 The contents of this website, unless otherwise stated, are licensed under a Creative Commons Attribution 4.0 International License.
The contents of this website, unless otherwise stated, are licensed under a Creative Commons Attribution 4.0 International License.
Am 15. und 16. Februar 2019 haben die Energy Data Hackdays\u00a0im Hightech Zentrum Aargau in Brugg statt gefunden.\u00a0Dank offenen Energie-Daten haben wir unser gemeinsames Energie-Verst\u00e4ndnis verbessert, und an 13 Projekten gearbeitet welche dazu beitragen, in Zukunft die Energieeffizenz in der Schweiz zu steigern. Mehr Informationen \u00fcber die Veranstaltung gibt es auf der Hackdays Webseite, die Ergebnisse sind hier und in den sozialen Medien.
\r\n","ends_at":"2019-02-16T14:00","gallery_url":"","has_finished":true,"has_started":false,"hashtags":"","hostname":"","id":24,"instruction":"# Offene Daten / Open Data\r\n\r\n| \r\n\r\nHier findest du die diversen offenen Energiedatens\u00e4tze, die wir f\u00fcr die Hackdays befreit, gesammelt und aufbereitet haben. Weitere Vorschl\u00e4ge und W\u00fcnsche k\u00f6nnen auf GitHub eingereicht werden. \r\n\r\nAuf Datenportale wie opendata.swiss gibt es weitere offene Datens\u00e4tze zu entdecken. Achten Sie auf die Einhaltung der Nutzungsbedingungen und die korrekte Angabe Ihrer offenen Datenquellen.\r\n\r\n | \r\n\r\nHere you can also find the diverse open energy datasets that we liberated, gathered and prepared for the Hackdays. Additional suggestions and requests can be submitted via GitHub.\r\n\r\nOn data portals like opendata.swiss you can discover more open datasets such as these. Make sure to follow the Terms of Use and correctly attribute your open data sources.\r\n\r\n |
 \r\n\r\n\r\n\r\n\r\n---\r\n\r\n[Welcome presentation](https://docs.google.com/presentation/d/1_OvkqqafuJ6eixh-WXfzi1raEp_HxmJae5gkj5drSpQ/edit?usp=sharing) / [Final presentation](https://docs.google.com/presentation/d/14E-sbhB0O3l0dhZ2ZGBOJPvddnIL0hPfOld2tWZbF34/edit#slide=id.g4fadce9fc2_0_83)","location":"Hightech Zentrum Aargau","location_lat":0.0,"location_lon":0.0,"logo_url":"https://energy.opendata.ch/files/2014/01/oed.png","name":"Energy Data Hackdays 2019","starts_at":"2019-02-15T09:00","summary":"Dank offenen Energie-Daten haben wir unser gemeinsames Energie-Verst\u00e4ndnis verbessert, und an 13 Projekten gearbeitet.","webpage_url":"https://opendata.ch/projects/energy-data-hackdays-2019-english/"}],"name":"events"},{"data":[{"autotext":"\n\n# Videmus\n\nEs geht darum, ein Tool zu entwicklen f\u00fcr die B\u00fcrgenpartizipation beim Melden von Zust\u00e4nden (Sch\u00e4den) an der Versorgungs-Infrastruktur. \n\nRecherchen haben ergeben, dass es solche Tools bereits gibt, so z.B. von der Stadt Z\u00fcrich ([zueriwieneu.ch](http://zueriwieneu.ch/)), als Teil der SBB Mobile App, von den IBB ([ibbrugg.ch](https://www.ibbrugg.ch/de/stoerungsmeldung)) und weitere. Diese erf\u00fcllen ihren Zweck offenbar gut, haben aber gewisse defizite. Zum einen sind sie nicht einfach zu bedienen, zum anderen werden die Daten nur isoliert betrachtet und nicht \u00f6ffentlich verf\u00fcgbar gemacht.\n\nZiel unseres Ansatzes ist es, solche Daten im Sinne von Open Data \u00f6ffentlich verf\u00fcgbar zu machen. Das Team hat ein Kollaborationsmodell entwickelt, das den Wert der Ver\u00f6ffentlichung solcher Daten aufzeigt. Die Besitzer/Betreiber der Infrastruktur haben grosses Interesse an solchen Meldungen, da es ihnen erlaubt, fehlbare Zust\u00e4nde schneller und mit weniger Personalaufwand zu erkennen. Zudem ist es f\u00fcr sie interessant, solche Daten \u00f6ffentlich zug\u00e4nglich zu machen, denn ein Betreiber allein hat nur wenige Daten und mit Zugriff auf die Daten aller Betreiber lassen sich aussagekr\u00e4ftigere Datenanalysen erstellen.\n\nWir haben gepr\u00fcft, ob die B\u00fcrger f\u00fcr solche Meldungen eine Belohnung erhalten sollten. Solche Belohnungen k\u00f6nnen z.B. in Form von Migros Cumulus Punkten erfolgen; bezahlt von den Infrastrukturbetreibern. Umfragen haben ergeben, dass es vermutlich besser ist, mit der intrinsischen Motivation der B\u00fcrger zu arbeiten. Man will ja auch nicht, dass die B\u00fcrger Objekte besch\u00e4digen, um dann eine Belohnung f\u00fcr eine Meldung zu bekommen.\n\nZudem haben wir mit einfachen Mitteln ein Online-Formular erstellt, mit welchem solche Meldungen gesammelt werden k\u00f6nnen. Die gesammelten Daten ver\u00f6ffentlichen wir als CSV.\n\nSiehe auch die Schlusspr\u00e4sentation: https://github.com/kreba/videmus/blob/master/videmus_4.pptx?raw=true\n\n## Data\n\nOnline Formular: https://form.jotformeu.com/90455619251357\n \nGesammelte Daten: https://docs.google.com/spreadsheets/d/e/2PACX-1vQAlHdhghXRPd7bSL8xOZZ2jyKiDd52i6nc4sGKIBZPOAjEgzGrnp94-cFBAqF-LDNQyfHjjBrAJYq1/pub?output=csv\n\nLandkarte: https://kreba.github.io/videmus/\n","autotext_url":"https://github.com/kreba/videmus","category_id":34,"category_name":"Dienste & Kunden","contact_url":"https://opendata-ch.slack.com/messages/CG99HHRSB","created_at":"2019-02-16T01:10","download_url":"","event_name":"Energy Data Hackdays 2019","event_url":"https://hack.opendata.ch/event/24","excerpt":"Videmus is a tool to develop a citizen participation for energy-related damage reports. It aims to allow citizens to easily report if they perceive a damage or potential point of improvement in their \"energetic\" surrounding. \r\n\r\n_Friday update:_ In the start phase we found that similar tools exist already and that it wouldn't make sense to program this tool again. Instead, we looked at business model and potential pain points in order to plan the implementation of such a tool. The idea now is to...","hashtag":"","id":338,"ident":null,"image_url":"https://github.com/kreba/videmus/raw/master/videmus-eyes.png","is_challenge":false,"is_webembed":false,"logo_color":"","logo_icon":"","longtext":"Videmus is a tool to develop a citizen participation for energy-related damage reports. It aims to allow citizens to easily report if they perceive a damage or potential point of improvement in their \"energetic\" surrounding. \r\n\r\n_Friday update:_ In the start phase we found that similar tools exist already and that it wouldn't make sense to program this tool again. Instead, we looked at business model and potential pain points in order to plan the implementation of such a tool. The idea now is to pool public utilities and find a business case for a potential startup.\r\n\r\n**Challenge**: [B\u00fcrger-partizipation](https://hack.opendata.ch/project/291)\r\n","maintainer":"oleg","name":"Videmus","phase":"Share","progress":50,"score":98,"source_url":"https://github.com/kreba/videmus","stats":{"commits":0,"during":5,"people":1,"sizepitch":651,"sizetotal":2978,"total":11,"updates":9},"summary":"Strengthening citizen participation in damage reports","team":"oleg, raffael.krebs","team_count":1,"updated_at":"2019-02-19T13:45","url":"https://hack.opendata.ch/project/338","webpage_url":""},{"autotext":"","autotext_url":"","category_id":36,"category_name":"Strommarkt","contact_url":"https://opendata-ch.slack.com/messages/CG89XCDD1","created_at":"2019-02-16T01:03","download_url":"","event_name":"Energy Data Hackdays 2019","event_url":"https://hack.opendata.ch/event/24","excerpt":"#### Challenge (siehe [Gamification Lastgang](https://hack.opendata.ch/project/282))\r\n- Die heutigen Stromtarife (Hoch- & Niedertarif) entsprechen nicht mehr den auf dem Strommarkt gehandelten Preisen\r\n- Die Lastgangkurven auf Bez\u00fcgerseite werden mit der Verf\u00fcgbarkeit von PV, Batteriespeichern und SmartHome Installationen nach und nach ver\u00e4ndert.\r\n- Durch den Mismatch der Preisanreize f\u00fcr Endkunden und EVUs k\u00f6nnen f\u00fcr EVUs erhebliche Gewinneinbussen entstehen.\r\n- \u00dcber Mittag wird der Strompreis ...","hashtag":"","id":336,"ident":null,"image_url":"","is_challenge":false,"is_webembed":false,"logo_color":"#ffffff","logo_icon":"","longtext":"#### Challenge (siehe [Gamification Lastgang](https://hack.opendata.ch/project/282))\r\n- Die heutigen Stromtarife (Hoch- & Niedertarif) entsprechen nicht mehr den auf dem Strommarkt gehandelten Preisen\r\n- Die Lastgangkurven auf Bez\u00fcgerseite werden mit der Verf\u00fcgbarkeit von PV, Batteriespeichern und SmartHome Installationen nach und nach ver\u00e4ndert.\r\n- Durch den Mismatch der Preisanreize f\u00fcr Endkunden und EVUs k\u00f6nnen f\u00fcr EVUs erhebliche Gewinneinbussen entstehen.\r\n- \u00dcber Mittag wird der Strompreis im internationelen Handel aufgrund der Produktion der Photovoltaikanlagen stark sinken\r\n- Unsere APP soll den EVUs aufzeigen, wie diese Einbussen durch Anpassung der Anreize vermieden werden k\u00f6nnen\r\n\r\n---\r\n\r\n#### L\u00f6sungsansatz\r\n[Unsere APP](https://julianschmuckli.github.io/energyhack19/) zeigt dem EVU auf, wie es den Lastgang seiner Stromkunden zu seinen Gunsten verbessern kann. Anhand realer Referenz-Lastg\u00e4nge und Strompreisen wird das neue Strommarkt-Design analysiert sowie untersucht, welche Parameter eine Anpassung des Lastgangs bewirken. Basierend auf diesen Erkenntnissen wird gemeinsam mit dem EVU eine neue Strategie entwickelt, welche die langfristige Zukunft der EVU sicherstellt. Dank der Optimierung der Strompreise gegen\u00fcber dem Endkunden, beispielweise mit dynamischen Strompreise, kann das EVU aktiv die Umgestaltung bew\u00e4ltigen und gleichzeitig die Energiewende voranbringen.\r\n\r\n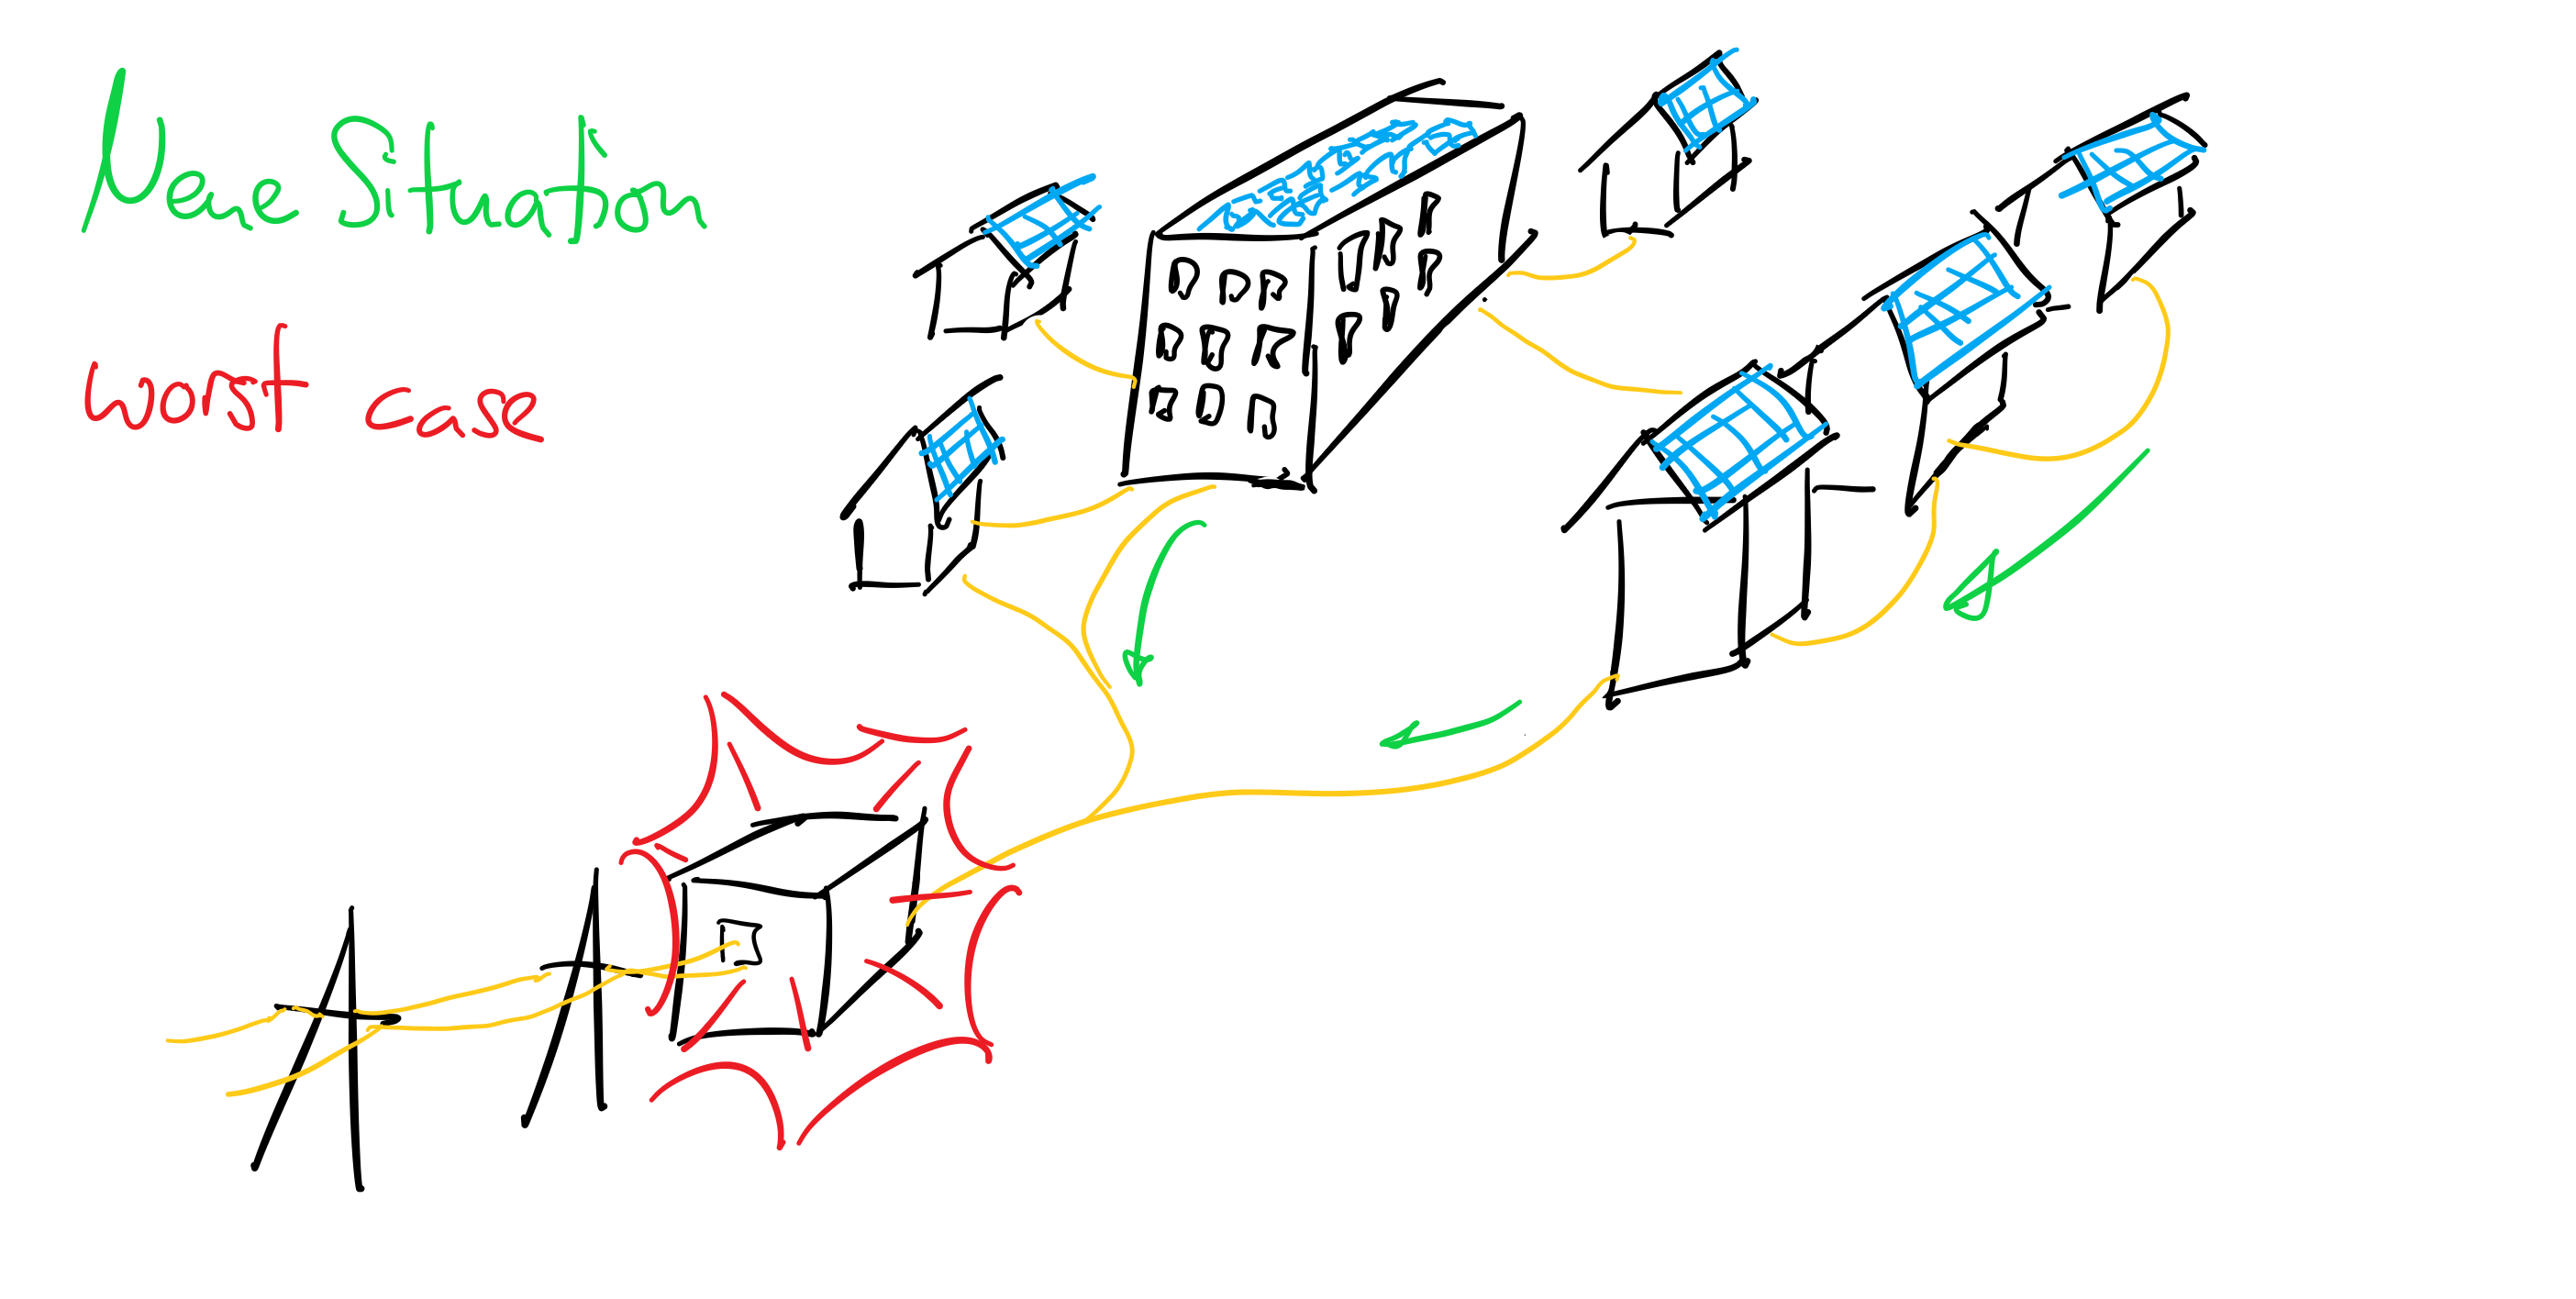\r\n\r\nMit unserem umfassenden Branchenkenntnis unterst\u00fctzen unsere Projektleiter und Developer die EVU's dabei, wie auch im Zeitalter des erneuerbaren Strommarktes die Unternehmenszukunft mit aktiver Mitgestaltung und neuen Gesch\u00e4ftsmodellen gesichert ist.\r\n\r\n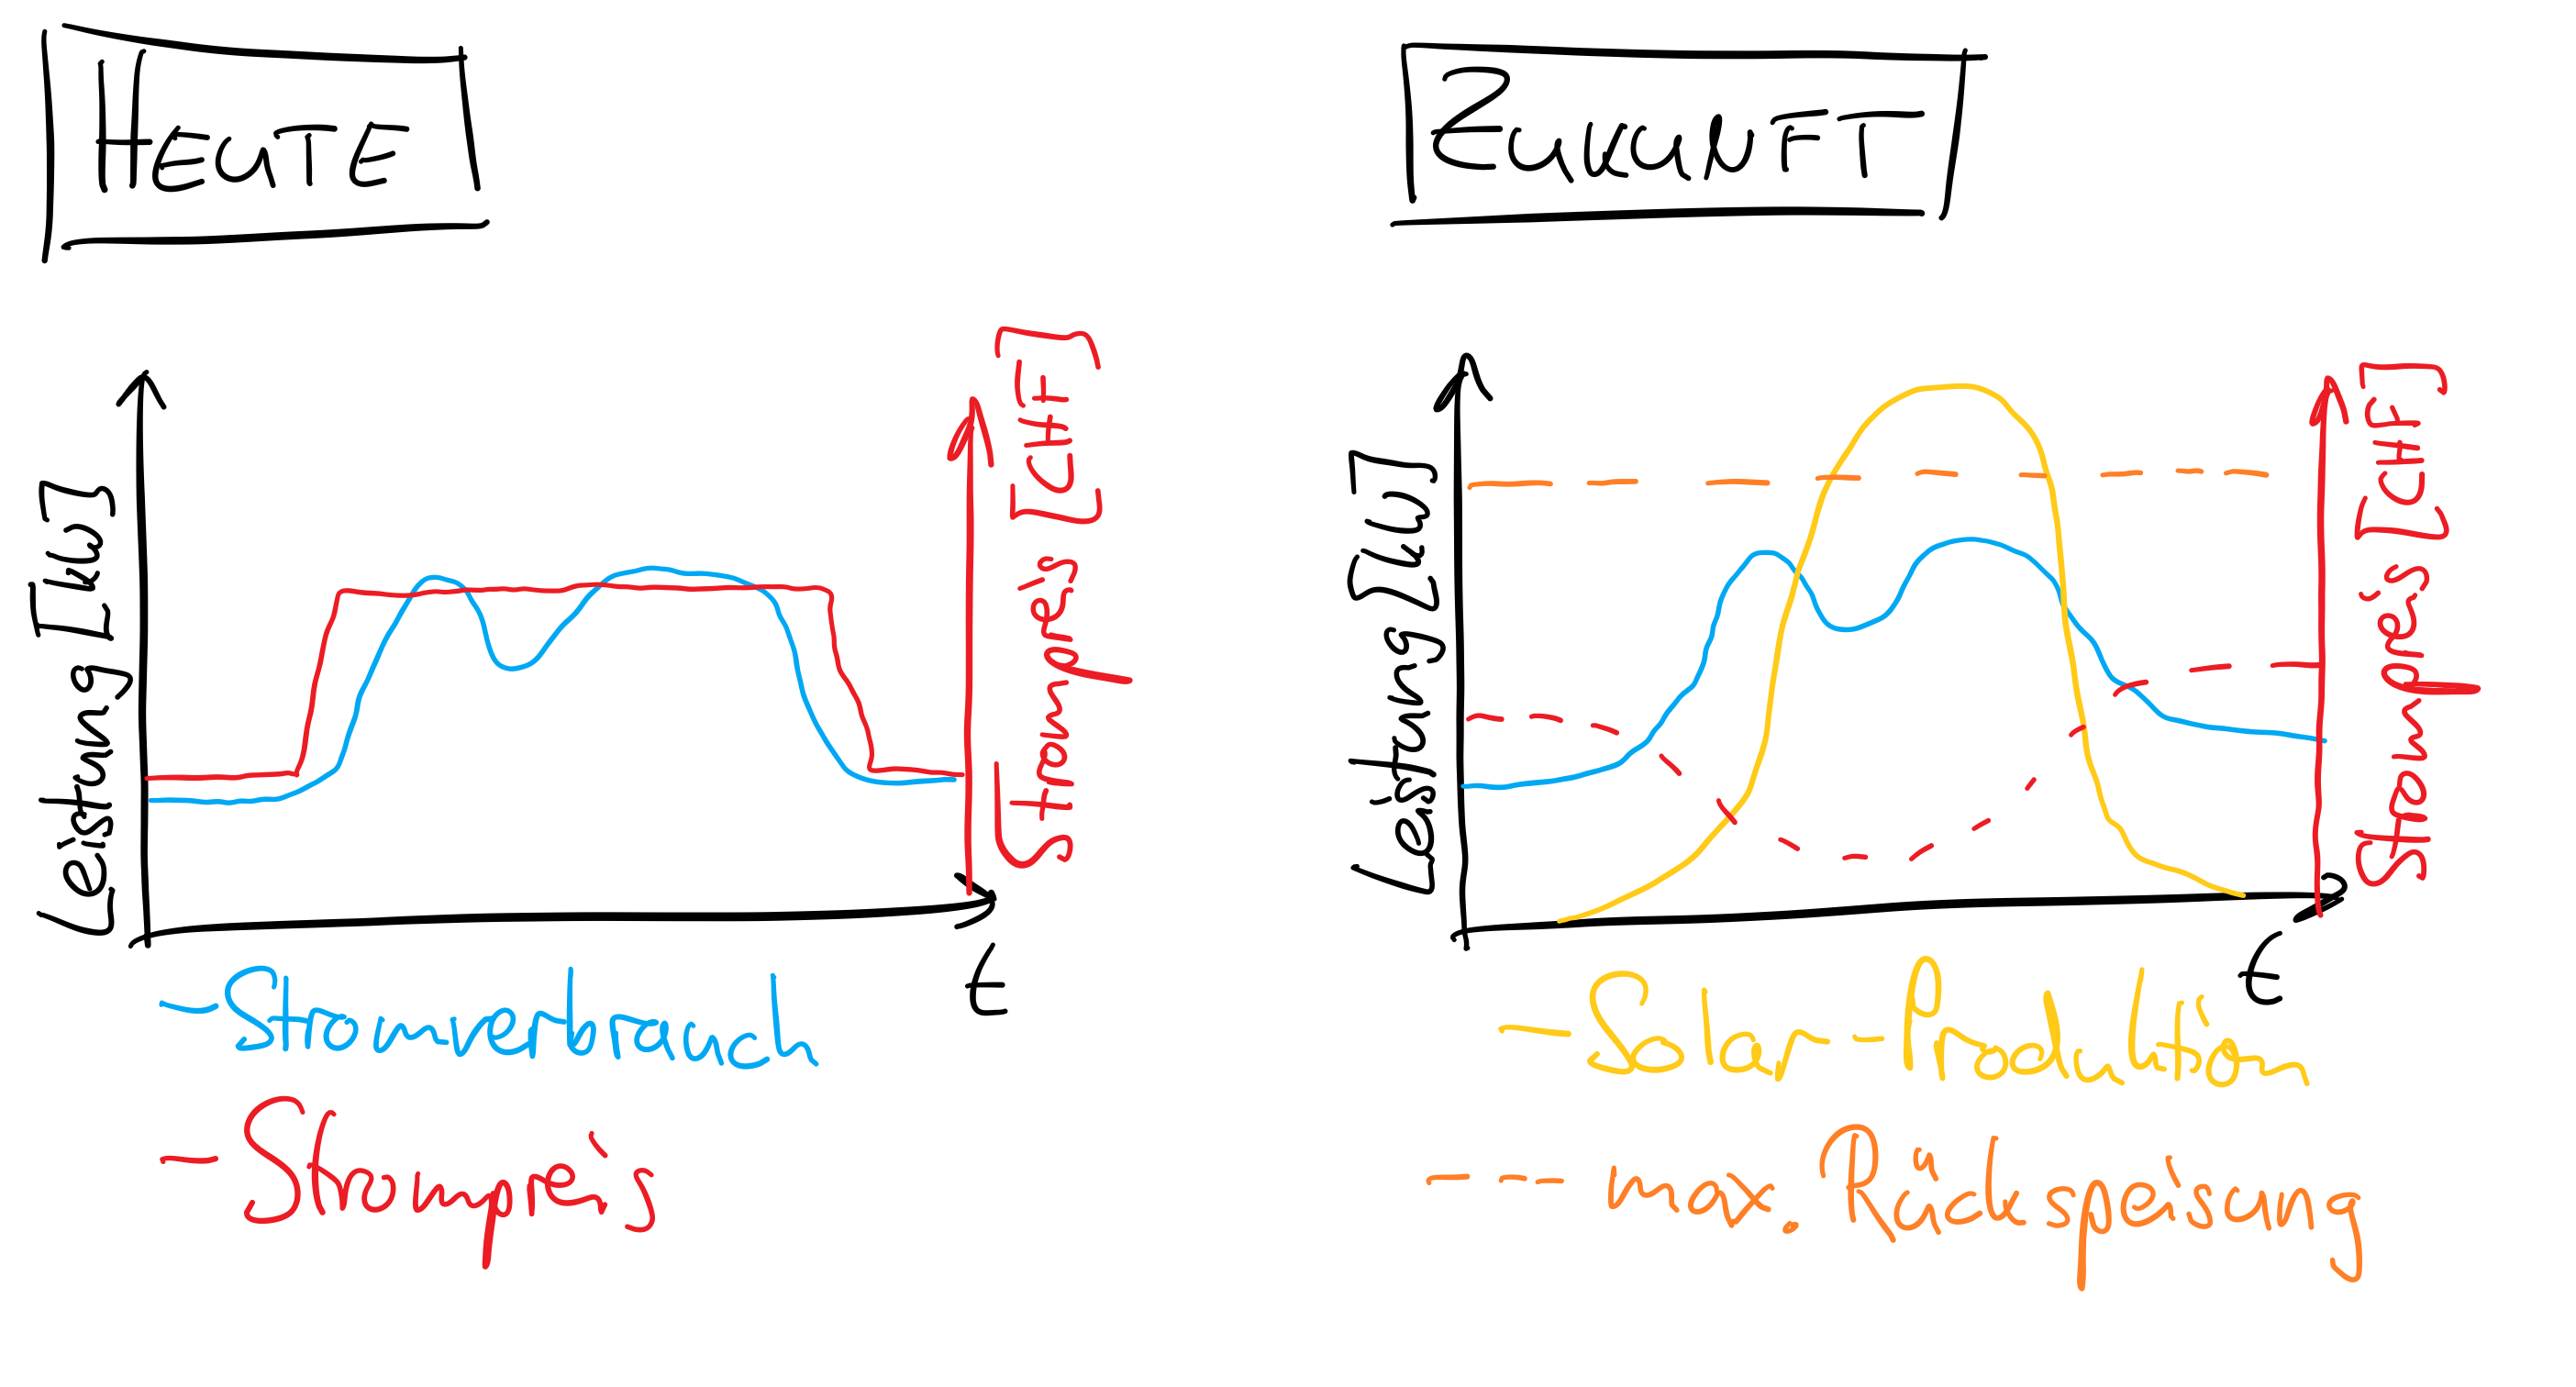\r\n---\r\n\r\n#### Team\r\nUnser Team besteht aus 2 Energie-Consultants, einem langj\u00e4hrigen Energie-Dienstleister und drei Web-APP Entwicklern:\r\n\r\n- [Thomas Str\u00f6sslin](mailto:thomas.stroesslin@app.ch), [APP Unternehmensberatung AG](http://www.app.ch)\r\n- Pascal St\u00e4deli, [Linkedin](https://www.linkedin.com/in/pascal-staedeli-a1b5ba13b/)\r\n- Marco Pertegato\r\n- Julian Schmuckli\r\n- Nils Egger\r\n- Leon Wink\r\n\r\n#### Vorgehen\r\n- Als Referenz-Lastgangkurve werden Daten aus dem Projekt [VEiN](http://www.vein-grid.ch/projekt.html) aufbereitet\r\n- Die Strompreise aus EPEX Spot werden gemittelt und normiert, um die st\u00fcndlichen Preise eines Referenztages zu erhalten\r\n- Als Preissignal wird ein gewichtetes Mittel zwischen EPEX Spot Preis und Hoch- & Niedertarif berechnet.\r\n- Die F\u00e4higkeit des Kunden, seinen Lastgang zu optimieren, wird anhand von 2 Parametern (Flexibilit\u00e4t Verbraucher sowie installierte Batterie) modelliert.\r\n- Der Lastgang wird mit Hilfe des normierten Preissignals optimiert\r\n\r\n#### Daten\r\n- Strompreise an der intraday Stromb\u00f6rse [EPEX Spot](http://www.epexspot.com)\r\n- Lastgangkurven aus VEiN\r\n- PV Produktionskurve aus eigenem Modell (Standort Z\u00fcrich, PVSyst)\r\n\r\n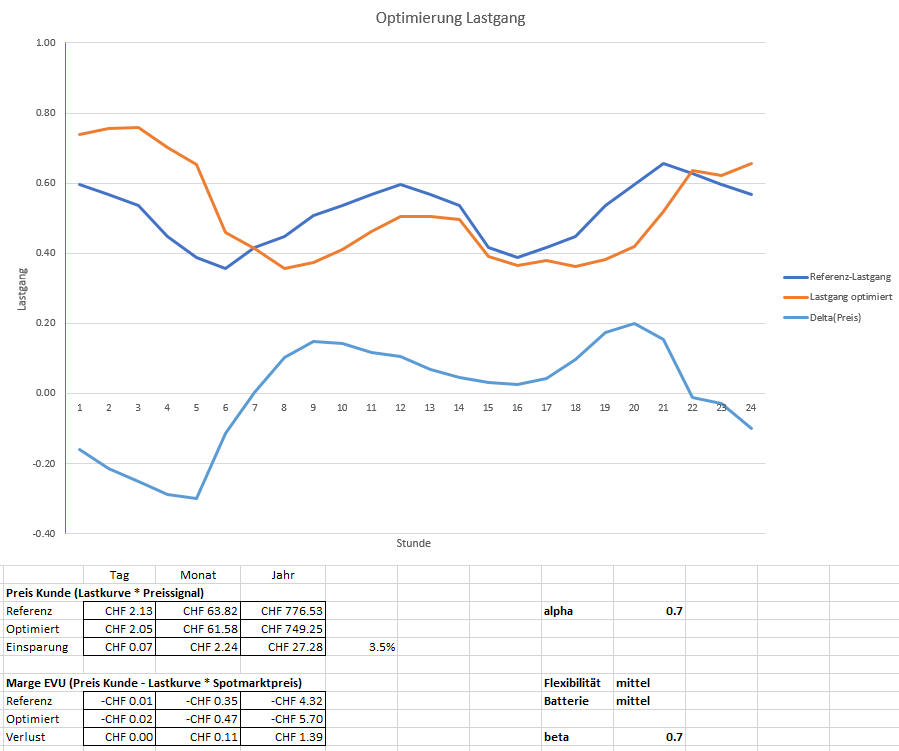\r\n\r\n#### Business Case\r\n\r\n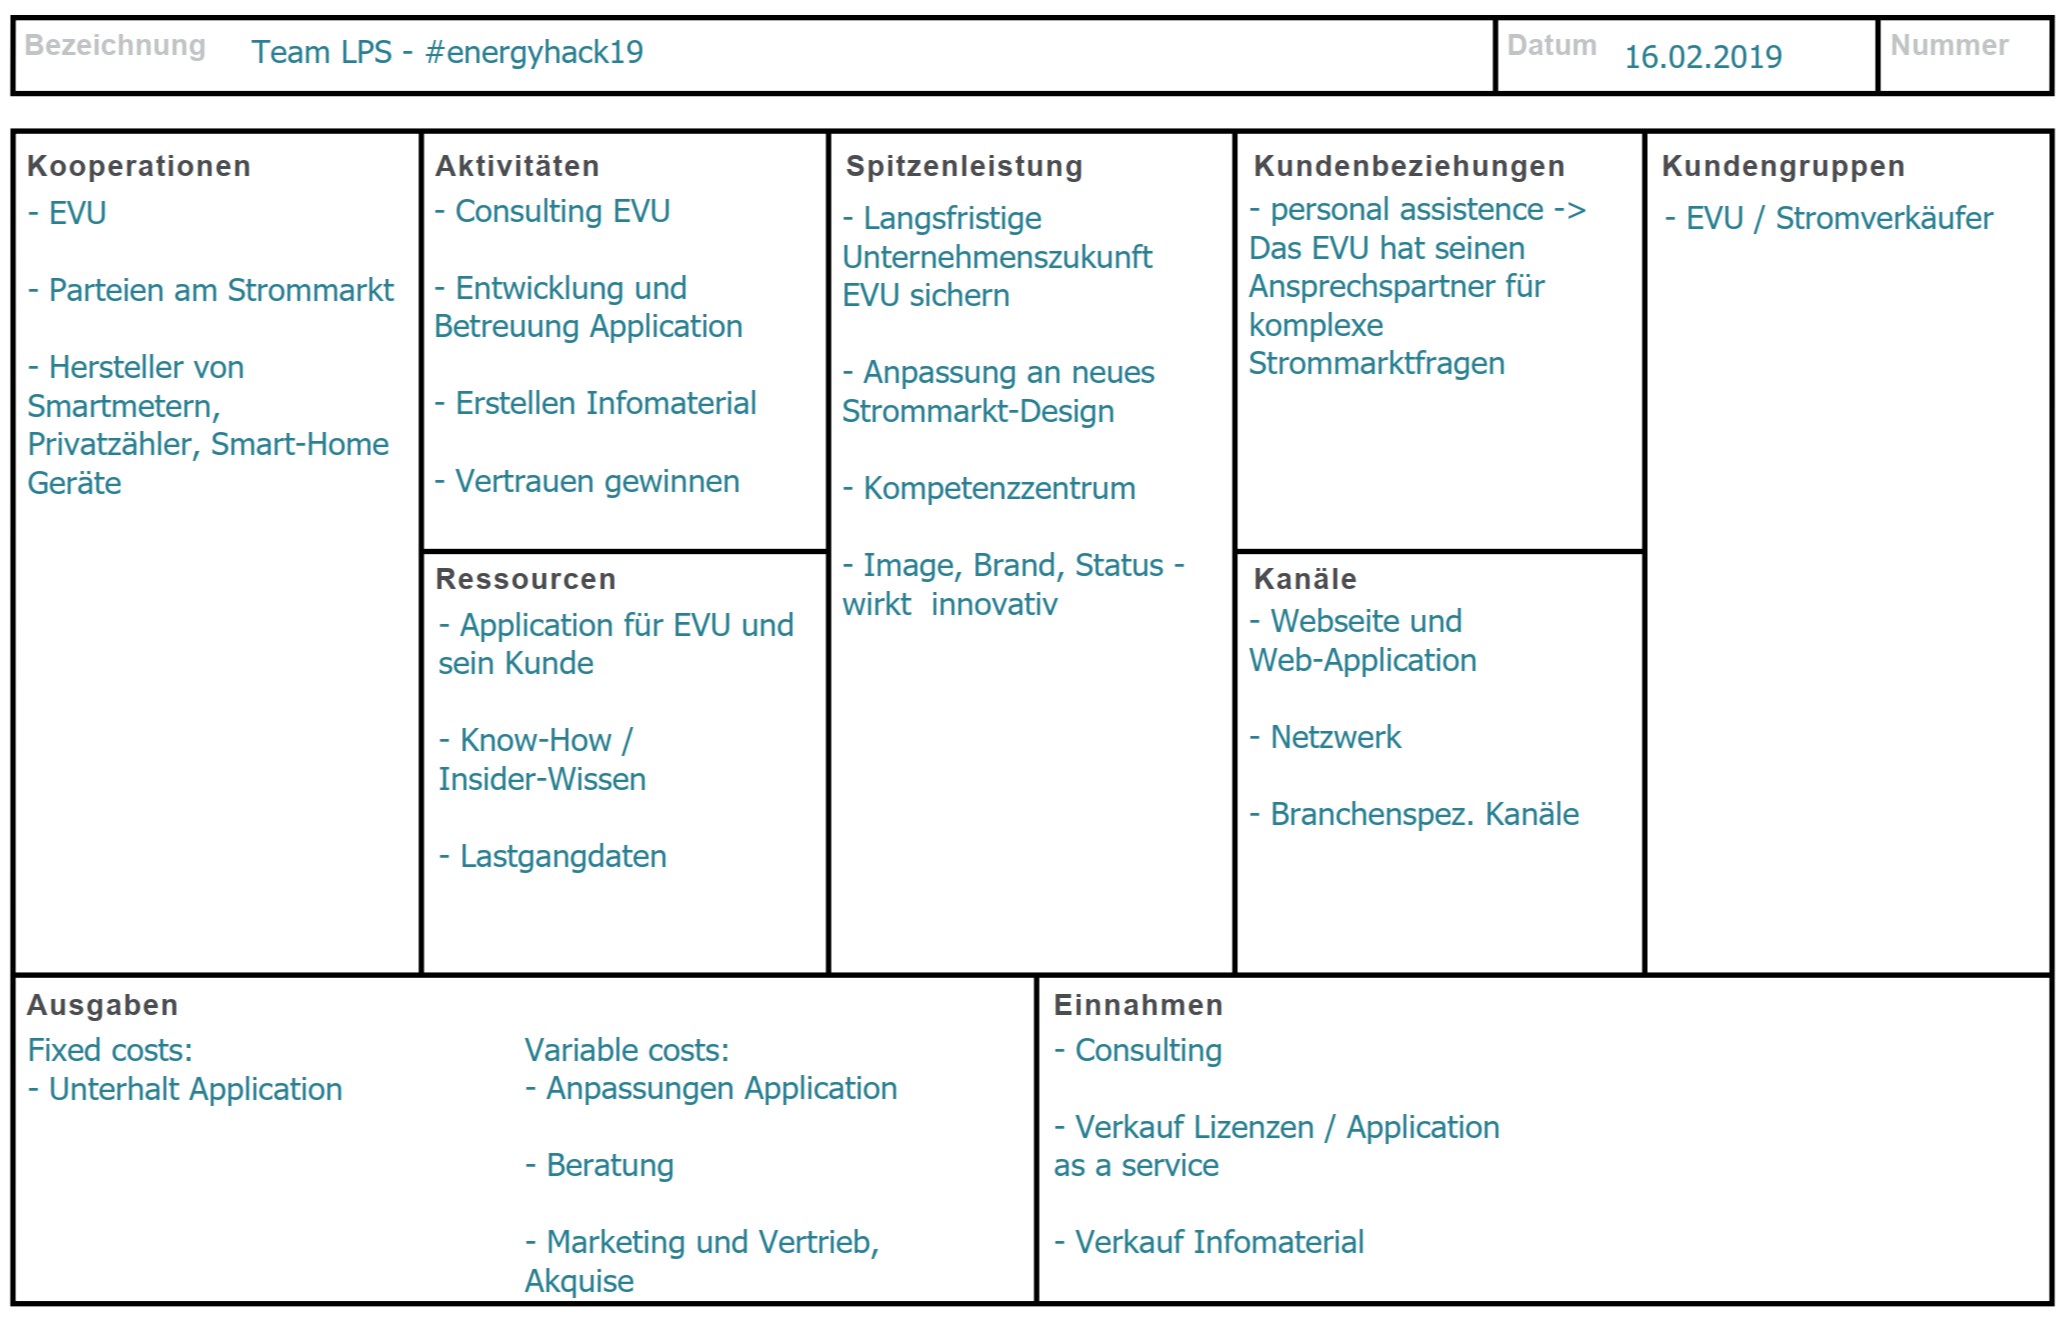\r\n\r\n","maintainer":"oleg","name":"Load Profile Shaping","phase":"Share","progress":50,"score":93,"source_url":"https://github.com/julianschmuckli/energyhack19","stats":{"commits":0,"during":33,"people":2,"sizepitch":3372,"sizetotal":3398,"total":41,"updates":38},"summary":"Lastgangskurven optimieren","team":"oleg, Tom, pascaaal","team_count":2,"updated_at":"2019-02-19T13:17","url":"https://hack.opendata.ch/project/336","webpage_url":"https://julianschmuckli.github.io/energyhack19/"},{"autotext":"# What is watt?\n\nThe goal of this project is to make the energy usage of different activities comparable. It is composed of two parts:\n\n1. Collecting data and creating parametrizable models\n2. Providing a gamified interface\n\n\n\nA first [Demo](https://jonasoesch.ch/content/work/what-is-watt/v1/) of the interface.\n\n\n## Hackathon\n\nWhat is watt was evolved during the [Energy Data Hackdays 2019](https://hack.opendata.ch/project/299) in the Hightech Zentrum in Brugg.\nMany thanks to: Anna, Germaine, Katharina, Madlaina, Sinan and Stephen.\n\nSome collected results:\n\n* [First Django prototype on Github](https://github.com/ghn/what-is-watt)\n* [First Django prototype on Heroku](https://what-is-watt.herokuapp.com/)\n* [Collected Data Google Drive](https://docs.google.com/spreadsheets/d/1zxXsOEeGS7a7RuXZQaTZvh2u-KGddcZD7lOGSA56lY8/edit)\n* [Frontend Github](https://github.com/Aadjou/whatiswatt)\n\n\n### Pitch\n\nZiel von *What is Watt* ist es, alles mit allem zu vergleichen. Wie viel Energie verbraucht meine t\u00e4gliche Pendler-Zugfahrt? (12.8 kWh) Und wie oft kann ich mit dieser Energie heiss duschen? (9 Mal) Oder einen Stock mit dem Lift fahren? (1200 Mal) Es bleibt am Ende die Entscheidung der einzelnen Person, ob sie nun n\u00e4her zu ihrem Arbeitsort zieht oder weniger lang/heiss duscht, um Energie zu sparen. \n\nNat\u00fcrlich h\u00e4ngen die obigen Werte von der Pendlerstrecke, der Duschdauer und der Liftart ab. Und auch was verglichen werden soll, ist oft sehr individuell. *What is Watt* ist deshalb auf allen Ebenen als offene Plattform konzipiert:\n\n1. **Offene Daten** dienen als Grundlage zur Berechnung der Szenarien.\n2. Die **Berechnungsmodelle** sind offen und dokumentiert. Man kann sie somit nachvollziehen, kritisieren und verbessern.\n3. Das Resultat jedes Szenarios ist ein Wert in Kilowattstunden. **Neue Szenarien** lassen sich so leicht hinzuf\u00fcgen und mit allen bestehenden vergleichen.\n4. *What is Watt* stellt die Szenarien \u00fcber eine **offene API** zur Verf\u00fcgung. Damit k\u00f6nnen **unterschiedliche Interfaces** und Visualisierungen die Daten auf ganz verschiedenste Art zug\u00e4nglich machen.\n\nDa alle vier Ebenen offen sind, ist es jedem m\u00f6glich zu *What is Watt* beizutragen. Typischerweise ist es ein neues Szenario, das jemanden pers\u00f6nlich interessiert. Wie viel Energie zum Beispiel eine Bitcoin-Transaktion verbraucht. Oder die eine Modelleisenbahn. Oder die E-Gitarre.\n\nDie Teilnehmer der [Energy Data Hackdays](https://hack.opendata.ch/event/24) k\u00f6nnen sich auf jeder der vier Ebenen bet\u00e4tigen und einen Beitrag zur Plattform liefern. \n\n\nUnd wer sich nun fragt, wie viel Energie eine Bitcoin-Transaktion verbraucht, hier die Antwort:\n\n
\r\n\r\n\r\n\r\n\r\n---\r\n\r\n[Welcome presentation](https://docs.google.com/presentation/d/1_OvkqqafuJ6eixh-WXfzi1raEp_HxmJae5gkj5drSpQ/edit?usp=sharing) / [Final presentation](https://docs.google.com/presentation/d/14E-sbhB0O3l0dhZ2ZGBOJPvddnIL0hPfOld2tWZbF34/edit#slide=id.g4fadce9fc2_0_83)","location":"Hightech Zentrum Aargau","location_lat":0.0,"location_lon":0.0,"logo_url":"https://energy.opendata.ch/files/2014/01/oed.png","name":"Energy Data Hackdays 2019","starts_at":"2019-02-15T09:00","summary":"Dank offenen Energie-Daten haben wir unser gemeinsames Energie-Verst\u00e4ndnis verbessert, und an 13 Projekten gearbeitet.","webpage_url":"https://opendata.ch/projects/energy-data-hackdays-2019-english/"}],"name":"events"},{"data":[{"autotext":"\n\n# Videmus\n\nEs geht darum, ein Tool zu entwicklen f\u00fcr die B\u00fcrgenpartizipation beim Melden von Zust\u00e4nden (Sch\u00e4den) an der Versorgungs-Infrastruktur. \n\nRecherchen haben ergeben, dass es solche Tools bereits gibt, so z.B. von der Stadt Z\u00fcrich ([zueriwieneu.ch](http://zueriwieneu.ch/)), als Teil der SBB Mobile App, von den IBB ([ibbrugg.ch](https://www.ibbrugg.ch/de/stoerungsmeldung)) und weitere. Diese erf\u00fcllen ihren Zweck offenbar gut, haben aber gewisse defizite. Zum einen sind sie nicht einfach zu bedienen, zum anderen werden die Daten nur isoliert betrachtet und nicht \u00f6ffentlich verf\u00fcgbar gemacht.\n\nZiel unseres Ansatzes ist es, solche Daten im Sinne von Open Data \u00f6ffentlich verf\u00fcgbar zu machen. Das Team hat ein Kollaborationsmodell entwickelt, das den Wert der Ver\u00f6ffentlichung solcher Daten aufzeigt. Die Besitzer/Betreiber der Infrastruktur haben grosses Interesse an solchen Meldungen, da es ihnen erlaubt, fehlbare Zust\u00e4nde schneller und mit weniger Personalaufwand zu erkennen. Zudem ist es f\u00fcr sie interessant, solche Daten \u00f6ffentlich zug\u00e4nglich zu machen, denn ein Betreiber allein hat nur wenige Daten und mit Zugriff auf die Daten aller Betreiber lassen sich aussagekr\u00e4ftigere Datenanalysen erstellen.\n\nWir haben gepr\u00fcft, ob die B\u00fcrger f\u00fcr solche Meldungen eine Belohnung erhalten sollten. Solche Belohnungen k\u00f6nnen z.B. in Form von Migros Cumulus Punkten erfolgen; bezahlt von den Infrastrukturbetreibern. Umfragen haben ergeben, dass es vermutlich besser ist, mit der intrinsischen Motivation der B\u00fcrger zu arbeiten. Man will ja auch nicht, dass die B\u00fcrger Objekte besch\u00e4digen, um dann eine Belohnung f\u00fcr eine Meldung zu bekommen.\n\nZudem haben wir mit einfachen Mitteln ein Online-Formular erstellt, mit welchem solche Meldungen gesammelt werden k\u00f6nnen. Die gesammelten Daten ver\u00f6ffentlichen wir als CSV.\n\nSiehe auch die Schlusspr\u00e4sentation: https://github.com/kreba/videmus/blob/master/videmus_4.pptx?raw=true\n\n## Data\n\nOnline Formular: https://form.jotformeu.com/90455619251357\n \nGesammelte Daten: https://docs.google.com/spreadsheets/d/e/2PACX-1vQAlHdhghXRPd7bSL8xOZZ2jyKiDd52i6nc4sGKIBZPOAjEgzGrnp94-cFBAqF-LDNQyfHjjBrAJYq1/pub?output=csv\n\nLandkarte: https://kreba.github.io/videmus/\n","autotext_url":"https://github.com/kreba/videmus","category_id":34,"category_name":"Dienste & Kunden","contact_url":"https://opendata-ch.slack.com/messages/CG99HHRSB","created_at":"2019-02-16T01:10","download_url":"","event_name":"Energy Data Hackdays 2019","event_url":"https://hack.opendata.ch/event/24","excerpt":"Videmus is a tool to develop a citizen participation for energy-related damage reports. It aims to allow citizens to easily report if they perceive a damage or potential point of improvement in their \"energetic\" surrounding. \r\n\r\n_Friday update:_ In the start phase we found that similar tools exist already and that it wouldn't make sense to program this tool again. Instead, we looked at business model and potential pain points in order to plan the implementation of such a tool. The idea now is to...","hashtag":"","id":338,"ident":null,"image_url":"https://github.com/kreba/videmus/raw/master/videmus-eyes.png","is_challenge":false,"is_webembed":false,"logo_color":"","logo_icon":"","longtext":"Videmus is a tool to develop a citizen participation for energy-related damage reports. It aims to allow citizens to easily report if they perceive a damage or potential point of improvement in their \"energetic\" surrounding. \r\n\r\n_Friday update:_ In the start phase we found that similar tools exist already and that it wouldn't make sense to program this tool again. Instead, we looked at business model and potential pain points in order to plan the implementation of such a tool. The idea now is to pool public utilities and find a business case for a potential startup.\r\n\r\n**Challenge**: [B\u00fcrger-partizipation](https://hack.opendata.ch/project/291)\r\n","maintainer":"oleg","name":"Videmus","phase":"Share","progress":50,"score":98,"source_url":"https://github.com/kreba/videmus","stats":{"commits":0,"during":5,"people":1,"sizepitch":651,"sizetotal":2978,"total":11,"updates":9},"summary":"Strengthening citizen participation in damage reports","team":"oleg, raffael.krebs","team_count":1,"updated_at":"2019-02-19T13:45","url":"https://hack.opendata.ch/project/338","webpage_url":""},{"autotext":"","autotext_url":"","category_id":36,"category_name":"Strommarkt","contact_url":"https://opendata-ch.slack.com/messages/CG89XCDD1","created_at":"2019-02-16T01:03","download_url":"","event_name":"Energy Data Hackdays 2019","event_url":"https://hack.opendata.ch/event/24","excerpt":"#### Challenge (siehe [Gamification Lastgang](https://hack.opendata.ch/project/282))\r\n- Die heutigen Stromtarife (Hoch- & Niedertarif) entsprechen nicht mehr den auf dem Strommarkt gehandelten Preisen\r\n- Die Lastgangkurven auf Bez\u00fcgerseite werden mit der Verf\u00fcgbarkeit von PV, Batteriespeichern und SmartHome Installationen nach und nach ver\u00e4ndert.\r\n- Durch den Mismatch der Preisanreize f\u00fcr Endkunden und EVUs k\u00f6nnen f\u00fcr EVUs erhebliche Gewinneinbussen entstehen.\r\n- \u00dcber Mittag wird der Strompreis ...","hashtag":"","id":336,"ident":null,"image_url":"","is_challenge":false,"is_webembed":false,"logo_color":"#ffffff","logo_icon":"","longtext":"#### Challenge (siehe [Gamification Lastgang](https://hack.opendata.ch/project/282))\r\n- Die heutigen Stromtarife (Hoch- & Niedertarif) entsprechen nicht mehr den auf dem Strommarkt gehandelten Preisen\r\n- Die Lastgangkurven auf Bez\u00fcgerseite werden mit der Verf\u00fcgbarkeit von PV, Batteriespeichern und SmartHome Installationen nach und nach ver\u00e4ndert.\r\n- Durch den Mismatch der Preisanreize f\u00fcr Endkunden und EVUs k\u00f6nnen f\u00fcr EVUs erhebliche Gewinneinbussen entstehen.\r\n- \u00dcber Mittag wird der Strompreis im internationelen Handel aufgrund der Produktion der Photovoltaikanlagen stark sinken\r\n- Unsere APP soll den EVUs aufzeigen, wie diese Einbussen durch Anpassung der Anreize vermieden werden k\u00f6nnen\r\n\r\n---\r\n\r\n#### L\u00f6sungsansatz\r\n[Unsere APP](https://julianschmuckli.github.io/energyhack19/) zeigt dem EVU auf, wie es den Lastgang seiner Stromkunden zu seinen Gunsten verbessern kann. Anhand realer Referenz-Lastg\u00e4nge und Strompreisen wird das neue Strommarkt-Design analysiert sowie untersucht, welche Parameter eine Anpassung des Lastgangs bewirken. Basierend auf diesen Erkenntnissen wird gemeinsam mit dem EVU eine neue Strategie entwickelt, welche die langfristige Zukunft der EVU sicherstellt. Dank der Optimierung der Strompreise gegen\u00fcber dem Endkunden, beispielweise mit dynamischen Strompreise, kann das EVU aktiv die Umgestaltung bew\u00e4ltigen und gleichzeitig die Energiewende voranbringen.\r\n\r\n\r\n\r\nMit unserem umfassenden Branchenkenntnis unterst\u00fctzen unsere Projektleiter und Developer die EVU's dabei, wie auch im Zeitalter des erneuerbaren Strommarktes die Unternehmenszukunft mit aktiver Mitgestaltung und neuen Gesch\u00e4ftsmodellen gesichert ist.\r\n\r\n\r\n---\r\n\r\n#### Team\r\nUnser Team besteht aus 2 Energie-Consultants, einem langj\u00e4hrigen Energie-Dienstleister und drei Web-APP Entwicklern:\r\n\r\n- [Thomas Str\u00f6sslin](mailto:thomas.stroesslin@app.ch), [APP Unternehmensberatung AG](http://www.app.ch)\r\n- Pascal St\u00e4deli, [Linkedin](https://www.linkedin.com/in/pascal-staedeli-a1b5ba13b/)\r\n- Marco Pertegato\r\n- Julian Schmuckli\r\n- Nils Egger\r\n- Leon Wink\r\n\r\n#### Vorgehen\r\n- Als Referenz-Lastgangkurve werden Daten aus dem Projekt [VEiN](http://www.vein-grid.ch/projekt.html) aufbereitet\r\n- Die Strompreise aus EPEX Spot werden gemittelt und normiert, um die st\u00fcndlichen Preise eines Referenztages zu erhalten\r\n- Als Preissignal wird ein gewichtetes Mittel zwischen EPEX Spot Preis und Hoch- & Niedertarif berechnet.\r\n- Die F\u00e4higkeit des Kunden, seinen Lastgang zu optimieren, wird anhand von 2 Parametern (Flexibilit\u00e4t Verbraucher sowie installierte Batterie) modelliert.\r\n- Der Lastgang wird mit Hilfe des normierten Preissignals optimiert\r\n\r\n#### Daten\r\n- Strompreise an der intraday Stromb\u00f6rse [EPEX Spot](http://www.epexspot.com)\r\n- Lastgangkurven aus VEiN\r\n- PV Produktionskurve aus eigenem Modell (Standort Z\u00fcrich, PVSyst)\r\n\r\n\r\n\r\n#### Business Case\r\n\r\n\r\n\r\n","maintainer":"oleg","name":"Load Profile Shaping","phase":"Share","progress":50,"score":93,"source_url":"https://github.com/julianschmuckli/energyhack19","stats":{"commits":0,"during":33,"people":2,"sizepitch":3372,"sizetotal":3398,"total":41,"updates":38},"summary":"Lastgangskurven optimieren","team":"oleg, Tom, pascaaal","team_count":2,"updated_at":"2019-02-19T13:17","url":"https://hack.opendata.ch/project/336","webpage_url":"https://julianschmuckli.github.io/energyhack19/"},{"autotext":"# What is watt?\n\nThe goal of this project is to make the energy usage of different activities comparable. It is composed of two parts:\n\n1. Collecting data and creating parametrizable models\n2. Providing a gamified interface\n\n\n\nA first [Demo](https://jonasoesch.ch/content/work/what-is-watt/v1/) of the interface.\n\n\n## Hackathon\n\nWhat is watt was evolved during the [Energy Data Hackdays 2019](https://hack.opendata.ch/project/299) in the Hightech Zentrum in Brugg.\nMany thanks to: Anna, Germaine, Katharina, Madlaina, Sinan and Stephen.\n\nSome collected results:\n\n* [First Django prototype on Github](https://github.com/ghn/what-is-watt)\n* [First Django prototype on Heroku](https://what-is-watt.herokuapp.com/)\n* [Collected Data Google Drive](https://docs.google.com/spreadsheets/d/1zxXsOEeGS7a7RuXZQaTZvh2u-KGddcZD7lOGSA56lY8/edit)\n* [Frontend Github](https://github.com/Aadjou/whatiswatt)\n\n\n### Pitch\n\nZiel von *What is Watt* ist es, alles mit allem zu vergleichen. Wie viel Energie verbraucht meine t\u00e4gliche Pendler-Zugfahrt? (12.8 kWh) Und wie oft kann ich mit dieser Energie heiss duschen? (9 Mal) Oder einen Stock mit dem Lift fahren? (1200 Mal) Es bleibt am Ende die Entscheidung der einzelnen Person, ob sie nun n\u00e4her zu ihrem Arbeitsort zieht oder weniger lang/heiss duscht, um Energie zu sparen. \n\nNat\u00fcrlich h\u00e4ngen die obigen Werte von der Pendlerstrecke, der Duschdauer und der Liftart ab. Und auch was verglichen werden soll, ist oft sehr individuell. *What is Watt* ist deshalb auf allen Ebenen als offene Plattform konzipiert:\n\n1. **Offene Daten** dienen als Grundlage zur Berechnung der Szenarien.\n2. Die **Berechnungsmodelle** sind offen und dokumentiert. Man kann sie somit nachvollziehen, kritisieren und verbessern.\n3. Das Resultat jedes Szenarios ist ein Wert in Kilowattstunden. **Neue Szenarien** lassen sich so leicht hinzuf\u00fcgen und mit allen bestehenden vergleichen.\n4. *What is Watt* stellt die Szenarien \u00fcber eine **offene API** zur Verf\u00fcgung. Damit k\u00f6nnen **unterschiedliche Interfaces** und Visualisierungen die Daten auf ganz verschiedenste Art zug\u00e4nglich machen.\n\nDa alle vier Ebenen offen sind, ist es jedem m\u00f6glich zu *What is Watt* beizutragen. Typischerweise ist es ein neues Szenario, das jemanden pers\u00f6nlich interessiert. Wie viel Energie zum Beispiel eine Bitcoin-Transaktion verbraucht. Oder die eine Modelleisenbahn. Oder die E-Gitarre.\n\nDie Teilnehmer der [Energy Data Hackdays](https://hack.opendata.ch/event/24) k\u00f6nnen sich auf jeder der vier Ebenen bet\u00e4tigen und einen Beitrag zur Plattform liefern. \n\n\nUnd wer sich nun fragt, wie viel Energie eine Bitcoin-Transaktion verbraucht, hier die Antwort:\n\n \n\n
\n\n\n\n\n## Running with Docker\n\nYou need to have Docker installed and running.\n\n```\ndocker build -t whatiswatt . \n```\nCreates a new docker image with all the necessary requirements\n\nTo run the application:\n\nOn macOS\n```\ndocker run -p 8888:8888 -v ~/Desktop/What-is-What:/app whatiswatt\n```\n\nOn Windows\n\n```\ndocker run -p 8888:8888 -v /c/Users/jonas/energyconverter:/app whatiswatt\n```\n\n[More information](https://github.com/rocker-org/rocker/wiki/Sharing-files-with-host-machine)\n","autotext_url":"https://github.com/jonasoesch/What-is-watt","category_id":34,"category_name":"Dienste & Kunden","contact_url":"https://opendata-ch.slack.com/messages/CG7HYKB89","created_at":"2019-02-16T01:24","download_url":"","event_name":"Energy Data Hackdays 2019","event_url":"https://hack.opendata.ch/event/24","excerpt":"Gut gemeinte Ratschl\u00e4ge sind weit verbreitet, wenn es darum geht Energie zu sparen. Aussagen wie \u00abL\u00f6sch das Licht, wenn du den Raum verl\u00e4sst\u00bb oder \u00abDu musst ja f\u00fcr ein Stockwerk nicht den Lift nehmen\u00bb sind gut gemeint. Die Ratschl\u00e4ge umzusetzen, ist jedoch immer mit einer Verhaltens\u00e4nderung verbunden. Die Erfahrung, wie schwierig es ist gute Vors\u00e4tze umzusetzen zeigt: jede Verhaltens\u00e4nderung ist teuer.\r\n\r\n**Demo**: https://jonasoesch.ch/content/work/what-is-watt/v2/\r\n\r\n**Challenge:** [What is Wa...","hashtag":"","id":344,"ident":null,"image_url":"https://www.jonasoesch.ch/content/02-articles/15-what-is-watt/logo.png","is_challenge":false,"is_webembed":false,"logo_color":"","logo_icon":"","longtext":"Gut gemeinte Ratschl\u00e4ge sind weit verbreitet, wenn es darum geht Energie zu sparen. Aussagen wie \u00abL\u00f6sch das Licht, wenn du den Raum verl\u00e4sst\u00bb oder \u00abDu musst ja f\u00fcr ein Stockwerk nicht den Lift nehmen\u00bb sind gut gemeint. Die Ratschl\u00e4ge umzusetzen, ist jedoch immer mit einer Verhaltens\u00e4nderung verbunden. Die Erfahrung, wie schwierig es ist gute Vors\u00e4tze umzusetzen zeigt: jede Verhaltens\u00e4nderung ist teuer.\r\n\r\n**Demo**: https://jonasoesch.ch/content/work/what-is-watt/v2/\r\n\r\n**Challenge:** [What is Watt](https://hack.opendata.ch/project/299) setzt einen Schritt vor dem Ratschlag an. Das Projekt hilft bei der Entscheidung, welche Verhaltens\u00e4nderungen sich wirklich lohnen. Damit auch die eigene Energie effizient eingesetzt wird.\r\n\r\n#### First Update\r\n\r\n_Right now we came up with the idea of having a map of all kinds of different things you can do with energy in your daily life. We want to let people explore this map of stuff, and to see how everything is related to everything. It is an ambitious goal which we will never reach this weekend. Still we think we will reach it, and will do our best. The data is available for most things, it's going pretty well. I hope we see some results in the next few hours._\r\n\r\n#### Second update\r\n\r\nWe have overhauled the interface and created a next iteration of the webapp:\r\n\r\n[https://jonasoesch.ch/content/work/what-is-watt/v2/](https://jonasoesch.ch/content/work/what-is-watt/v2/)\r\n\r\n\r\n#### Data\r\n\r\n- [Daten](https://docs.google.com/spreadsheets/d/1zxXsOEeGS7a7RuXZQaTZvh2u-KGddcZD7lOGSA56lY8/edit#gid=0) (Google Spreadsheet)\r\n\r\n#### Source\r\n\r\n- https://github.com/jonasoesch/What-is-watt\r\n- https://github.com/ghn/what-is-watt\r\n","maintainer":"oleg","name":"What is Watt","phase":"Prototype","progress":30,"score":88,"source_url":"https://github.com/ghn/what-is-watt","stats":{"commits":0,"during":4,"people":1,"sizepitch":1767,"sizetotal":5684,"total":21,"updates":19},"summary":"What is Watt helps individuals to understand the energy need of different devices and activities.","team":"oleg, jonasoesch","team_count":1,"updated_at":"2019-07-03T09:19","url":"https://hack.opendata.ch/project/344","webpage_url":"https://jonasoesch.ch/content/work/what-is-watt/v2/"},{"autotext":"# openData_eniwa\n\nWir haben uns bei der Erstellung der Blackoutkarte vorerst auf das Medium Elektro beschr\u00e4nkt, wobei der Ansatz grunds\u00e4tzlich auf andere Medien \u00fcbertragen werden kann und auch f\u00fcr andere Grundlagedaten angewendet werden kann. Herausforderung war und wird sein passende Grundlagedaten f\u00fcr die Analysen zu finden. Als Tool wurde vorwiegend [QGIS](https://www.qgis.org/de/site/) verwendet\n\nAls erstes haben wir verschiedene Gefahren definiert.\n\n\n\nAls n\u00e4chstens haben wir die unterschiedlichen Karten vereinheitlicht und normert, damit sie im n\u00e4chsten Schritt miteinander verrechnet werden k\u00f6nnen. So wurden die unterschiedlichen Farben in hohes Risiken mit dem Wert 200, mittleres Risiko 100 und geringes Risiko 50 konvertiert. Die normierten Risiken wurden nun zusammen addiert. Die Risiken k\u00f6nnen beim addieren noch unterschiedlich gewichtet werden. In unserem Beispiel haben wir die beiden verwendeten Risiken gleich gewichtet.\n\n\n\nDie bestehenden Leitungen inkl. Einteilung der Wichtigkeit der Leitungen lag als CSV vor und wurde mittels [SpatialLite](https://www.gaia-gis.it/fossil/libspatialite/index) in QGIS hinzugef\u00fcgt. Die gewichtete Risikokarte wurde mit den Leitungen multipliziert, wodurch die neuralgischen Punkte aufgrund Risikowahrscheinlichkeit und Relevanz der Anlagen/Leitugen ermittelt werden konnten.\n\n\n\nDie gewichtete Risikokarte wurde weiter in QGIS als 3D-Map visualisiert und mit den Leitungen \u00fcberlagert. \nDas Risiko bestimmt die H\u00f6he des Gel\u00e4ndes, das heisst je h\u00f6her ein Punkt, umso wahrscheinlicher ein Vorfall.\n\n\nDie Berechnungen wurden in [Python](https://gitlab.com/maegman/opendata_eniwa/raw/master/Python/ColorUnify.py) umgesetzt und als [QGIS Analysen](https://gitlab.com/maegman/opendata_eniwa/raw/master/Dokumentation/Dokumentation_QGIS%20Analysen.pdf)\n","autotext_url":"https://gitlab.com/maegman/opendata_eniwa","category_id":33,"category_name":"Netze","contact_url":"https://opendata-ch.slack.com/messages/CG7LXH6EL","created_at":"2019-02-16T01:14","download_url":"","event_name":"Energy Data Hackdays 2019","event_url":"https://hack.opendata.ch/event/24","excerpt":"[Challenge](https://hack.opendata.ch/project/287) \r\n\r\n[Link to presentation](https://gitlab.com/maegman/opendata_eniwa/raw/master/Dokumentation/Blackout%20Map.pdf?inline=false) (PDF)\r\n\r\n[Link to QGIS Projekt including Layers](https://gitlab.com/maegman/opendata_eniwa/tree/master/blackout_risikokarte)","hashtag":"","id":340,"ident":null,"image_url":"","is_challenge":false,"is_webembed":false,"logo_color":"","logo_icon":"","longtext":"[Challenge](https://hack.opendata.ch/project/287) \r\n\r\n[Link to presentation](https://gitlab.com/maegman/opendata_eniwa/raw/master/Dokumentation/Blackout%20Map.pdf?inline=false) (PDF)\r\n\r\n[Link to QGIS Projekt including Layers](https://gitlab.com/maegman/opendata_eniwa/tree/master/blackout_risikokarte)","maintainer":"oleg","name":"Blackout Karte","phase":"Share","progress":50,"score":85,"source_url":"https://gitlab.com/maegman/opendata_eniwa","stats":{"commits":0,"during":16,"people":1,"sizepitch":301,"sizetotal":2546,"total":31,"updates":29},"summary":"Identify causes of blackouts in networks","team":"oleg, maeg","team_count":1,"updated_at":"2019-02-18T19:42","url":"https://hack.opendata.ch/project/340","webpage_url":""},{"autotext":"VisiStrom\n======\n\nVisistrom helps individuals to plan using electricity at a good time in order to use sustainable energy as much as possible. \nIn turn, this behaviour helps utility companies to reduce energy purchases from expensive sources like coal and oil plants. \n\n## Energy Hack Days \n\nThis project emerged from the following Open Energy Hack Days challenge: [Visistrom challenge](https://hack.opendata.ch/project/289).\n\n\n**16.02.2019, 08:00 - Second Update:**\nA basic version of the prototype is running.\n\n**15.02.2019, 18:00 - First Update:**\nWe realized that it is not just about consuming as little as you can - it is also important that when you consume the electricity, you want to avoid coal-produced electricity. Some solar energy is being produced, sometimes it is good to use electricity when the sun is shining. We are trying to come up with a good visualization to tell this message. There are three recommendations for the end user: now is a good time to use electricity, now you should save, or just keep going. We are quite advanced with visualization, we have some nice data we can use, but the challenge is how to decide when to recommend using electricity.\n\n## Design Challenge\nHow might we visualize peaks, valleys and provenance of electric power,\nso that end consumers know when consumption and production is most ecological and/or cheapest?\n\n## Business Goals\nMinimize the necessity to buy expensive, \"dirty\" electricity (produced from oil and coal).\n\n- reduce peaks (peak shaving)\n- reduce unplanned differences in consumption and production\n\n## Data Analytics\nTo make a recommendation of when to use electricity or not, we need to try to avoid peaks in consumption, at the individual household level, and at the area level. \n\n\n### 1. Consumption for a given household\nPredict consumption peaks and valleys for a given time based on the household's past consumption:\n- for a given hour during the day (e.g. from 3pm to 4pm)\n- on a given day of the week (e.g. Saturday)\n- in a given month of the year (e.g. July)\n--> not using that at the moment yet\n\nAt the moment, the front-end app prototype uses the non-processed usage data from last year as a proxy prediction. \n\n**Data source:** \n\n[Aggregated load profiles of apartment blocks](https://github.com/schoolofdata-ch/energy-data/issues/3)\n01. Aug 2017 - 31. Aug 2018\n\n*These are Smartmeter measurments in 15-minute intervalls by blocks of flats (usually about 3-8). It's not by individual households, but this is a good enough apporximation for now.*\n\n### 2. Consumption for Kanton of Aargau, SwissGrid\nAs a proxy for prediction data from the utility provider\n[Energie\u00fcbersicht 2018, Swissgrid (Kanton Aargau)](https://www.swissgrid.ch/de/home/operation/grid-data/generation.html#endverbrauchte-energie)\nScaled down to match \n01.01.2018-31.12.2018\n\n\n### 3. Consumption for a given area (TO DO)\nPredict consumption peaks and valleys for a given time based on the area's past consumption:\n- for a given hour during the day (e.g. from 3pm to 4pm)\n- on a given day of the week (e.g. Saturday)\n- in a given month of the year (e.g. July)\n\n**Data source:**\n- [Aggregated load profiles of apartment blocks](https://github.com/schoolofdata-ch/energy-data/issues/3) (summed up)\n- Or alternatively: load profiles from Trafo stations (not openly available)\n\n\n\n### 4. Solar panel production for a given household\nPredict production peaks and valleys for a given time based on sunlight and on the household' past solar panel production:\n- for a given hour during the day (e.g. from 3pm to 4pm)\n- on a given day of the week (e.g. Saturday)\n- in a given month of the year (e.g. July)\n\n**Data sources:** \n[Solarenergie Prognose from NETSTRANSPERNENZ](https://www.netztransparenz.de/Weitere-Veroeffentlichungen/Solarenergie-Prognose)\n\nOptional data to refine the prediction at household level: Past production of solar electricity for this household\n\n\n## Functionality \n\nThe functionality purpose for the consumers is:\n- to adapt their behaviors to have cleaner energy usage\n- to see their progression in energy consumption over time\n\nTo adapt their behaviors, accessible data of factors impacting energy production will be shown to the user. Such include prevision of solar intensity for the upcoming week, coupled with other data such as past average consumption habits of the Club. Data can also integrate predictable special events susceptible to induce consequent perturbation in the general consumption (e.g. World Cup Football).\n\nThe integrated data is presented to the user in the form of a table showing predicted energy conditions for the upcoming week, for every hour. The table will highlight the day and hours when clean energy will be the more available among the week. This will enable users to plan their energy most consuming tasks (usually cooking and housekeeping) according to external energy availabiity conditions.\n\n\nThe user will be able to click on the case of the table to access to more details explaining the reasons why he/she should stay to his current task planification or move it to anothe time:\n- sunlight availability\n- saturation of Club\n- etc.\n\nTo see their progression over time, consumers will have access to the profile curve of their past days, weeks and months consumptions. They will also be able to see the difference between their actual daily consumption of a specific weekday with average of past consumption for the same weekday.\n\n\n\n\n### Home Screen\nThe Home Screen is split in half. In the upper part, an icon is shown as a quick and easy-to-understand indicator for the user - a call to action. The icon shows one of three states:\n\n- the lightbulb is turned on, which means that the club produces more energy than expected and the user is welcomed to increase his or her energy consumption (invest more energy)\n- the lightbulb is turned of, which means that the club consumes more energy than expected and the user is welcomed to decrease his or her energy consumption (save some energy for later)\n- the lightbulb is cut in half showing a balance of a turned on and turned off light, which means that the club is on track and the user does not need to change anything.\n\nA click on the icon will show the user a forecast of the lightbulb so he or she can plan their energy consumption ahead.\n\n### Forecast Screen\nAs an end consumer, I want to know when is the best time to use electricity in the coming hours and days, so that I can plan energy-intensive tasks accordingly (e.g. doing the laundry, charging my electric car,...)\n\n**Implementation:** The Lightbulb Forecast Screen shows a series of lightbulbs from top to bottom. Each lightbulb belongs to a specific time period (e.g. 1 hour, 1 pm - 2pm). Similar to the lightbulb on the Home Screen, the lightbulbs indicate whether the specific period is more likely to be a period to spend or save energy. \n\n\n\n\n## Backlog (not implemented yet)\n\n### Notification / Reminder: \n**User Story:** As an end consumer, I want to get notified of the best time to use electricity, so I don't have to check the app actively. \n\n**Implementation:** On the \"Forecast\" screen, a click on one of the lightbulbs (= time period) gives the user the option to set a reminder (e.g. to vacuum clean).\n\n\n### Drill-Down\nAs an end consumer, I want to see the forecasted consumption and production for a particular time period (e.g. today 3-4pm), so that I understand why I get a recommendation to use or save electricity at that time. \n\n\n### My Realm Screen (not yet implemented, coming soon)\nThe My Realm Screen shows the energy consumption of the user's home or flat using a simple graph. The data is limited to the last 24 hours. If possible, different energy consumers will be shown separately as well as aggregated. As an example, the bas load (typical household appliances), the usage of the battery, the pv production as well as the consumption of the heatpump could be shown. The user can switch between the aggregated view, showing only \"what flows into / out of the house\" or the detailed view.\n\n### My Club Screen (not yet implemented, coming soon)\n*Club is the term for a group of customers connected to the same network node*\nSimilar to the My Realm Screen, the My Club Screen shows a simplified overview of the electricity network area the user is connected to (automatically determined, login required). On the one hand, the graph shows the performance of the network within the last 24 hours. On the other hand, the graph shows the number of participants or rather their aggregated energy consumption and production in order to highlight the ratio and improve that.\n\n### My History Screen (not yet implemented, coming soon)\nThe My History Screen provides a filter mechanism to specify a period of interest. As an example, the user can select from last day, last week, specific week, last month, specific month, last season, specific season, last year and custom from/to dates. The specified period is then being displayed as a graph whereas the scaling is determined by the period itself. Additionally, the user can add a second period of the same kind in order to start comparing time series. As an example, the user could compare the last week with the same week a year ago.\n\n### Compare Appliances Screen (not yet implemented, coming soon)\nThe Compare Appliances Screen is meant to support the user in acquisition decisions. It focuses on the operational costs based on electricity consumption of the specified appliances. In the first version, the user can input 5 values into the form:\n- electricity consumption when turned on in Watt\n- hours of operation per year in hours\n- electricity consumption when in stand by in Watt\n- hours in stand by per year in hours\n- electricity cost (default value provided by operator)\n\nAfter putting the values in, the estimated electricity costs of that appliance is being shown. The user can add multiple appliances in order to compare them.\n\nAdditionally, a list of typical values is being shown, as for example the number of hours a tv is being operated in general (as a rule of thumb).\n\n### What can I do Screen (not yet implemented, coming soon)\nIn the first versions of the What can I do Screen, a list of typical electrical appliances will be shown. The list should help the user to decide which devices can be turned on or turned off, depending on the current situation. In later versions, these options can be improved by\n- showing only appliances the user actually has\n- highlighting appliances that can actually be turned on or turned off (e.g. not showing a boiler that is already beeing running)\n- sorting the list in a smart way (taking the power consumption, ramp up time, saving potential, etc. into account)\n\n### Supportive Messages (not yet implemented, coming soon)\nThe system motivates the user by displaying a supportive message every now and then. A message can be displayed when the user simply opens the app/website (e.g. 'It's nice to see you here', 'Welcome back!'). More importantly, a message should be shown if the user has seen a call to action (e.g. lightbulb is turned on) and the system notices that the energy consumption of the user actually dropped (e.g. 'Thank you for your support, you helped the Club!').\n","autotext_url":"https://github.com/derrickoswald/Visistrom","category_id":34,"category_name":"Dienste & Kunden","contact_url":"https://opendata-ch.slack.com/messages/CG9DAKUDV","created_at":"2019-02-16T01:06","download_url":"","event_name":"Energy Data Hackdays 2019","event_url":"https://hack.opendata.ch/event/24","excerpt":"VisiStrom\n======\n\nVisistrom helps individuals to plan using electricity at a good time in order to use sustainable energy as much as possible. \nIn turn, this behaviour helps utility companies to reduce energy purchases from expensive sources like coal and oil plants. \n\n## Energy Hack Days \n\nThis project emerged from the following Open Energy Hack Days challenge: [Visistrom challenge](https://hack.opendata.ch/project/289).\n\n\n**16.02.2019, 08:00 - Second Update:**\nA basic version of the prototype ...","hashtag":"","id":337,"ident":null,"image_url":"","is_challenge":false,"is_webembed":true,"logo_color":"","logo_icon":"far fa-lightbulb","longtext":"","maintainer":"oleg","name":"Visistrom","phase":"Launch","progress":40,"score":83,"source_url":"https://github.com/derrickoswald/Visistrom","stats":{"commits":0,"during":14,"people":2,"sizepitch":0,"sizetotal":11541,"total":21,"updates":18},"summary":"Using electricity at the right time help to avoid unsustainable sources","team":"oleg, emilieboillat, Alessandro Cuozzo","team_count":2,"updated_at":"2019-02-19T11:36","url":"https://hack.opendata.ch/project/337","webpage_url":"https://derrickoswald.github.io/Visistrom/"},{"autotext":"# Energie-Erneuerungsplanung\n## Topic: Algorithmic solution for valuing consequences in infrastructure maintenance\n\nThis project reflects this [challenge](https://hack.opendata.ch/project/341)\n\n### Challenge\nMaintenance of company assets of the low-voltage power distribution grid should be prioritized based on asset state and asset importance. While the state of the asset, typically the age since the last maintenance, is well-document, there is currently no measure of importance for these assets. One idea to value the importance of the assets is to analyze the amount of energy that is distributed by them. The amount of consumption is, of course, not an optimal measure for how damage is caused by an asset breakdown, or for what consumer would pay for an insurance against power interupts - if they were allowed to pay for it. This challenge, therefore, leave it open how, for the purpose of optimization, the importance will be measured.\n\n### Provided Data\nThe data that was provided consisted of\n- List and point coordinates of transformer stations\n- List and point coordinates of distribution enclosures\n- List and point coordinates of consumers\n- List and line coordinates of connection lines\n- Anonymized consumption data for the last four years\n\n### Approach\nSince no importance measure was given, but consumption can be considered a first good proxy and consumption is only known per consumer but not per connection line, distribution enclosure or transformer station, the first part of the project was dedicated to enriching the data by calculating these figures.\n\nThe second part of the project focussed on the optimization of the prioritization of maintenance work based on a flexible importance measure.\n\n### Data enrichment\nThe basic idea is to calculate the amount of energy that flows through transformer stations, distribution enclosures and connection lines by analyzing the topology of the network, starting from the transformer stations. This topology is constructed from the point and line coordinates. The quality of the coordinates is high enough to do this correctly.\n\n\nAfter the topology of the network and the distrance from the transformer stations is created, the yearly power consumption is aggregated for each element of this network starting with the ones that are the furthest away from the transformer stations. The maximum depth of the network is 17 hops.\n\nThe data is visualized in an open source software QGIS. This calculated data is added to the network elements such that the visualization can be enhanced by this data. The size of the points and the width of the lines now corresponds to the amount of energy that flows through this element.\n\nThis is a larger view of the results.\n(brown - transformer station, red - distribution enclosure, orange - consumer, red - connection line)\n\n\nThis is a more detailled view of the results.\n\n\n### Optimization\n[A single bitcoin transaction uses the same amount of electricity as 176 hot showers. So enjoy one more month of showering this year instead of shopping in bitcoin ;-) pic.twitter.com/iVKOGbEems
— Jonas Oesch (@jonasoesch) May 21, 2018
 ](https://twitter.com/algo_tecture)\n\n### References\nhttp://geopandas.org/reference.html\n","autotext_url":"https://github.com/2D/EnergieErneuerungsplanung","category_id":34,"category_name":"Dienste & Kunden","contact_url":"https://opendata-ch.slack.com/messages/CG8P68BJR","created_at":"2019-02-16T01:16","download_url":"","event_name":"Energy Data Hackdays 2019","event_url":"https://hack.opendata.ch/event/24","excerpt":"#### Challenge \r\n\r\n- [Erneuerungs-planung](https://hack.opendata.ch/project/301)\r\n\r\n**Objectives**\r\nWert von der Standhaltung und die Folgen von Infrastrukturhaltung. \r\nTopogie und Geometrie von der Betriebsnetz rekonstruieren.\r\n\r\n**Process**\r\nBased on existing Geodata a graph-based model was made. \r\nThe optimisation algorithm was applied to find an optimal path. \r\n\r\n#### Data\r\nChallenge_Unterhalt_Ausbau\r\nShape data format .shp\r\nExcel data over energy consumption per dwelling or commercial prope...","hashtag":"","id":341,"ident":null,"image_url":"https://github.com/2D/EnergieErneuerungsplanung/raw/master/energy-hackathon-341-0.png","is_challenge":false,"is_webembed":false,"logo_color":"#1ba51e","logo_icon":"battery-full","longtext":"#### Challenge \r\n\r\n- [Erneuerungs-planung](https://hack.opendata.ch/project/301)\r\n\r\n**Objectives**\r\nWert von der Standhaltung und die Folgen von Infrastrukturhaltung. \r\nTopogie und Geometrie von der Betriebsnetz rekonstruieren.\r\n\r\n**Process**\r\nBased on existing Geodata a graph-based model was made. \r\nThe optimisation algorithm was applied to find an optimal path. \r\n\r\n#### Data\r\nChallenge_Unterhalt_Ausbau\r\nShape data format .shp\r\nExcel data over energy consumption per dwelling or commercial property\r\n\r\n#### Tools\r\n\r\nThis team analysed the value and importance of infrastructure maintenance work, using following tools \u2192 QGIS, rhino, grasshopper, mapbox, jupyter notebook (used libraries are to be updated).\r\n\r\nThe Slack channel #energy-plan is used for communication. \r\n\r\n#### Results\r\n\r\nOptimisation Algorithm was applied over a graph for finding the required maintenance root. \r\n\r\nFormed a working version on the [GitHub](https://github.com/2D/EnergieErneuerungsplanung)\r\n\r\n### Team\r\n\r\nMembers are @wolfram and @dimi","maintainer":"oleg","name":"Algorithmische Erneuerungsplanung","phase":"Prototype","progress":30,"score":82,"source_url":"https://github.com/2D/EnergieErneuerungsplanung","stats":{"commits":0,"during":26,"people":2,"sizepitch":1023,"sizetotal":4271,"total":30,"updates":27},"summary":"Value consequences in maintenance infrastructure for power supply","team":"oleg, wolfram, dimi","team_count":2,"updated_at":"2019-02-19T11:27","url":"https://hack.opendata.ch/project/341","webpage_url":""},{"autotext":"","autotext_url":"","category_id":33,"category_name":"Netze","contact_url":"https://opendata-ch.slack.com/messages/CG8S4B14M","created_at":"2019-02-16T01:12","download_url":"","event_name":"Energy Data Hackdays 2019","event_url":"https://hack.opendata.ch/event/24","excerpt":"Geb\u00e4udepass is developing a \"building passport\" that documents and portrays all relevant energy-related information about a building. The goal is to develop a concept that helps the state, canton, municipalities and / or cities to evaluate their state and needs when it comes to buildings.\r\n\r\n---\r\n\r\n**Challenge:** [Geb\u00e4ude-pass](https://hack.opendata.ch/project/300)\r\n**Demo:** [abdagon.wwwnl1-ls3](http://abdagon.wwwnl1-ls3.a2hosted.com/bp/web/)\r\n\r\n# Challenge Ergebnisse\r\n\r\n**Die Ergebnisse sind i...","hashtag":"","id":339,"ident":null,"image_url":"","is_challenge":false,"is_webembed":true,"logo_color":"","logo_icon":"","longtext":"Geb\u00e4udepass is developing a \"building passport\" that documents and portrays all relevant energy-related information about a building. The goal is to develop a concept that helps the state, canton, municipalities and / or cities to evaluate their state and needs when it comes to buildings.\r\n\r\n---\r\n\r\n**Challenge:** [Geb\u00e4ude-pass](https://hack.opendata.ch/project/300)\r\n**Demo:** [abdagon.wwwnl1-ls3](http://abdagon.wwwnl1-ls3.a2hosted.com/bp/web/)\r\n\r\n# Challenge Ergebnisse\r\n\r\n**Die Ergebnisse sind in einer Pr\u00e4sentation und deren Anhang dokumentiert, inkl. Visualisierungen** (siehe oben)\r\n\r\n## Research\r\n\r\n* In Europa bestehen viele Studien und Projekte f\u00fcr Geb\u00e4udep\u00e4sse (Pr\u00e4sentation Anhang)\r\n* F\u00fcr Geb\u00e4udesanierungen existiert eine ausgereifte L\u00f6sung eValo\r\n* Viele Daten existieren, sind aber nicht zug\u00e4nglich\r\n\r\n## Potentiell verf\u00fcgbare Daten f\u00fcr Geb\u00e4udepass \"Cloud\"\r\n\r\n* GWR (Geb\u00e4ude- und Wohnungsregister)\r\n* EVU CRM, Leitung-Kataster, ...\r\n* Sonnendach\r\n* Erdw\u00e4rme\r\n* Feuerungs Datenbank\r\n* Pro Novo (SwissGrid Photovoltaik)\r\n* Evtl. dynamische Messdaten (Strom, Heizungsrechnung)\r\n\r\n## Datenhack Raumw\u00e4rme Aarau\r\n\r\nGWR enth\u00e4lt potentiell viele Daten, darf jedoch nicht in vollem Umfang genutzt werden - der Datenhack war auf Raumw\u00e4rme und Warmwasser Aarau beschr\u00e4nkt\r\n\r\n## Geb\u00e4udepass \u00abCloud\u00bb - Zielsetzung\r\n\r\n* Nutzung **existierender Daten** \u2013 Vermeidung von Mehrfach-Erfassungen\r\n* Plattform f\u00fcr **Energie- und Investitions-Optimierung** f\u00fcr Geb\u00e4udebesitzer, Gemeinden, Kantone, Bund, Energieversorger\r\n* Nutzung **erg\u00e4nzender Daten** f\u00fcr plausible, konkrete und fr\u00fchzeitige Optimierungs-Vorschl\u00e4ge (z.B. Verf\u00fcgbarkeit Gas, Fernw\u00e4rme, ...)\r\n* Prozesse (inkl. Validierung) und Anreize (z.B. Steuererleichterungen) f\u00fcr **hohe Datenqualit\u00e4t**\r\n\r\n## Geb\u00e4udepass \u00abCloud\u00bb - Nutzen\r\n\r\n### Geb\u00e4udebesitzer\r\n\r\n* Vorschl\u00e4ge f\u00fcr Sanierungsmassnahmen\r\n* Business Cases f\u00fcr Energie Optimierungen\r\n* \u201cPreventive Maintenance\u201d\r\n* \u201cLogbuch\u201d f\u00fcr Sanierungen\r\n* Dokumentation f\u00fcr Verkauf\r\n\r\n### Gemeinden, Kantone, Bund, Energieversorger\r\n\r\n* Verbesserung Datenqualit\u00e4t mit Bev\u00f6lkerung\r\n* Energieplanung\r\n* Umsetzung Strategie 2050\r\n* Validierung F\u00f6rderungsystem\r\n* Quantifizierung\r\n* Simulation, Szenarien\r\n\r\n## Geb\u00e4udepass \u00abCloud\u00bb - Prototyp\r\n\r\nAuf der CMS Drupal Plattform wurde mit einem Aufwand von ca. 1 Stunde ein einfacher Prototyp f\u00fcr einen webbasierten Prototyp entwickelt, um die m\u00f6gliche Funktionalit\u00e4t zu demonstrieren. Eine solche Anwendung hat ohne Daten jedoch nur einen geringen Nutzen.\r\n\r\nhttp://abdagon.wwwnl1-ls3.a2hosted.com/bp/web/\r\n\r\n## Geb\u00e4udepass \u00abCloud\u00bb - Erkenntnisse\r\n\r\n* Einzell\u00f6sungen vorhanden\r\n* Fehlende Integration \u2013 Mehrfacherfassungen n\u00f6tig \ud83e\udd2e\r\n* Teilweise ungen\u00fcgende Datenqualit\u00e4t \u2013 fehlerhafte bzw. veraltete Daten\r\n* Sehr viele Daten existierend \u2013 aber in Silos und nicht zug\u00e4nglich\r\n* **Nutzung m\u00f6glichst vieler bestehender Daten \u2013 mit kontrolliertem Zugang**\r\n* **Datenzugang mit Identifikation erm\u00f6glichen, Nutzung protokollieren**\r\n\r\n## Geb\u00e4udepass \u00abCloud\u00bb - Projekt\r\n\r\n* Fokus Gemeinde \u2013 **PoC Aarau**, mit Zukunftsregion Argovia\r\n* Daten von GWR, EVU \u2013 eValo Anbindung\r\n* Zugang mit Identifikation (SwissID)\r\n* \u00abAbfragen\u00bb f\u00fcr Nutzen Optionen\r\n\r\n**Erstes update**\r\n\r\nWir haben uns \u00fcberlegt wie eine Geb\u00e4udepass aussehen k\u00f6nnten, verschiedene Daten angeschaut. Es gibt in andere L\u00e4ndern bereits L\u00f6sungen f\u00fcr den Geb\u00e4udepass - wir fokussieren uns um die Frage, wie wir an die Daten herankommt. 2 Problemfelder: die Daten sind z.T. nicht \u00f6ffentlich zug\u00e4nglich, auch wenn durch Steuer bezahlt. Was man zusammenkriegt gen\u00fcgt nicht zum zusammenzuladen. Wir haben den Geb\u00e4udepass gedacht f\u00fcr Geb\u00e4udebesitzer. Eine sch\u00f6ne Grafik w\u00e4re interessant auch f\u00fcr Bund, Kantone, Gemeinde zum gemeinsame Bilder von Bedarf zu setzen. Wir sind am abkl\u00e4ren ein Projekt zu machen mit der Zukunftsregion Aargau. Wir haben uns gefragt wer und wo interessiert w\u00e4re mitzumachen. Stadt Aargau pr\u00fcft schon ob sie k\u00f6nnten eine Proof of Concept machen. Wir \u00fcberlegen uns wie das Projekt aussieht, und ganz schnell zu Prototypen kommen.","maintainer":"oleg","name":"Geb\u00e4udepass \"Cloud\"","phase":"Share","progress":50,"score":82,"source_url":"","stats":{"commits":0,"during":16,"people":2,"sizepitch":4043,"sizetotal":4076,"total":19,"updates":16},"summary":"Solutions for a Building Passport","team":"oleg, nikki_bhler, PeterJanes","team_count":2,"updated_at":"2019-02-19T07:56","url":"https://hack.opendata.ch/project/339","webpage_url":"https://docs.google.com/presentation/d/e/2PACX-1vTt4XECeh-KjnKd8qU1Zc53ggsUGwKyLIhPU4OgBK2ibel-dXV1ADx5oPtuXYKu75WA0EAklK7rPJaB/embed?start=false&loop=false&delayms=3000"},{"autotext":"","autotext_url":"","category_id":32,"category_name":"Produktion","contact_url":"https://opendata-ch.slack.com/messages/CG946F5DM","created_at":"2019-02-15T16:04","download_url":"","event_name":"Energy Data Hackdays 2019","event_url":"https://hack.opendata.ch/event/24","excerpt":"We created a web app that allows users to check the status of their solar installations by evaluating if the energy production is at a normal state. Our application aims at providing a quick verification of the monthly energy production of rooftop solar panels. The user will provide the following input:\r\n\r\n1. Location of the solar panel: address\r\n2. Size of PV: area in m2\r\n3. Capacity kWp\r\n4. 12 months of production data\r\n \r\nThe app looks up the estimations from [sonnendach](https://www.uvek-gi...","hashtag":"","id":302,"ident":null,"image_url":"","is_challenge":false,"is_webembed":false,"logo_color":"","logo_icon":"","longtext":"We created a web app that allows users to check the status of their solar installations by evaluating if the energy production is at a normal state. Our application aims at providing a quick verification of the monthly energy production of rooftop solar panels. The user will provide the following input:\r\n\r\n1. Location of the solar panel: address\r\n2. Size of PV: area in m2\r\n3. Capacity kWp\r\n4. 12 months of production data\r\n \r\nThe app looks up the estimations from [sonnendach](https://www.uvek-gis.admin.ch/BFE/sonnendach/?lang=de), compares the the input and returns: \r\n\r\n1. Location on map\r\n2. Status: ok or not ok\r\n3. Monthly comparison of actual vs. reference as a bar chart\r\n\r\nSee our [wiki](https://github.com/cype/PVDiagnose/wiki) for more information.\r\n\r\nHere the web app prototype (1) [user interface](http://energy-data-hackdays-d.s3-website.eu-central-1.amazonaws.com/) and (2) [output results - bar chart](http://energy-data-hackdays-d.s3-website.eu-central-1.amazonaws.com/results.html) and [diagnosis](http://energy-data-hackdays-d.s3-website.eu-central-1.amazonaws.com/results1.html)\r\n\r\nTeam members: Tetiana, Adrian, Andreas, Angelos, Bogdan, Braulio, Daniel, David, Martin (@Mhertach) and Tobias","maintainer":"nikki_bhler","name":"PV Diagnose","phase":"Prototype","progress":30,"score":76,"source_url":"https://github.com/cype/PVDiagnose","stats":{"commits":0,"during":29,"people":4,"sizepitch":1217,"sizetotal":1311,"total":30,"updates":25},"summary":"An application for small scale PV owners to check whether their installation is still healthy.","team":"nikki_bhler, brauliobarahona, Andreas, tanapolg","team_count":4,"updated_at":"2019-02-16T13:44","url":"https://hack.opendata.ch/project/302","webpage_url":"http://energy-data-hackdays-d.s3-website.eu-central-1.amazonaws.com/"},{"autotext":"","autotext_url":"","category_id":35,"category_name":"Mobilit\u00e4t","contact_url":"https://opendata-ch.slack.com/messages/CG8AA61NX","created_at":"2019-02-16T01:20","download_url":"","event_name":"Energy Data Hackdays 2019","event_url":"https://hack.opendata.ch/event/24","excerpt":"**Projektziel**\r\n\r\nPlanungshilfe f\u00fcr neue Standorte von E-Mobil-Ladestationen, die \u00f6ffentlich zug\u00e4nglich sind. \r\n\r\n**Analyse der Ausgangslage und Formulierung der Fragestellung**\r\n\r\nDie unterschiedlichen Stakeholder (Verteilnetzbetreiber, Gemeinde, Nutzer eine Elektromobils) wurden analysiert und deren Anforderungen an Standorte f\u00fcr Ladestationen formuliert. Anschliessend wurden die Nutzungsformen (Private Nutzung f\u00fcr Einkaufen, Besuche / Arbeitsnutzung zum Pendeln oder Kundenbesuche / Freizeitn...","hashtag":"","id":342,"ident":null,"image_url":"https://upload.wikimedia.org/wikipedia/commons/thumb/e/e7/Font_Awesome_5_solid_charging-station.svg/128px-Font_Awesome_5_solid_charging-station.svg.png","is_challenge":false,"is_webembed":true,"logo_color":"#bee59e","logo_icon":"","longtext":"**Projektziel**\r\n\r\nPlanungshilfe f\u00fcr neue Standorte von E-Mobil-Ladestationen, die \u00f6ffentlich zug\u00e4nglich sind. \r\n\r\n**Analyse der Ausgangslage und Formulierung der Fragestellung**\r\n\r\nDie unterschiedlichen Stakeholder (Verteilnetzbetreiber, Gemeinde, Nutzer eine Elektromobils) wurden analysiert und deren Anforderungen an Standorte f\u00fcr Ladestationen formuliert. Anschliessend wurden die Nutzungsformen (Private Nutzung f\u00fcr Einkaufen, Besuche / Arbeitsnutzung zum Pendeln oder Kundenbesuche / Freizeitnutzung f\u00fcr Ausfl\u00fcge oder Reisen) der unterschiedlichen Nutzer (Familien, Einzelpersonen, Paare, \u00e4ltere Personen...) unterschiedlicher Wohnformen (Einfamilienhaus, Mehrfamilienhaus, Eigentum oder Miete, st\u00e4dtisch oder l\u00e4ndlich) mit unterschiedlichen Mobilit\u00e4tsformen (Privatauto, Miet- oder Sharing-Auto, Velo, Zug oder Tram/Bus) analysiert. Dazu k\u00f6nnte eine detaillierte Informationendatenbank aufbereitet werden. \r\n\r\n**Prototyp**\r\n\r\nNach der Betrachtung vorhandener Daten und m\u00f6glicher Umsetzungen aus Sicht der unterschiedlichen Stakeholder wurde f\u00fcr dieses Projekt beschlossen, dass ein Prototyp einer GIS-basierten Planungshilfe f\u00fcr Gemeinden erstellt wird. Mit der bestehenden Datengrundlage f\u00fcr den Kanton Aargau wie \u00f6ffentlich zug\u00e4ngliche Ladestationen, Park&Ride Standorte, Park&Pool Standorte und Parkpl\u00e4tze des Tiefbauamts kann die Karte analysiert und Indizien f\u00fcr zus\u00e4tzliche Ladestandorte eruiert werden. \r\n\r\n**Weitere Bearbeitung des Prototyps**\r\n\r\nWas zus\u00e4tzlich eingebunden werden k\u00f6nnte: visualisierte Pendlerstr\u00f6me, Hauptverkehrsachsen (als Heatmap), SBB-Bahnh\u00f6fe, Standort von Trafostationen, Standort von PV-Anlagen, Standort von Batterien, bestehende (konventionelle) Tankstellen, Auslastung (Anzahl und Dauer der Parkplatznutzung, Anzahl und Dauer der Ladevorg\u00e4nge) der Lades\u00e4ulen...\r\n\r\n**Teamwork**\r\n\r\nUnserer Team ist Freitag leider von 6 auf 3 geschrumpft. Ein Grossteil der Zeit wurde verwendet, die Fragestellung zu diskutieren, den UseCase einzugrenzen und vorhandene Daten zu finden. Am Samstag haben wir den Prototypen umgesetzt und das Projekt dokumentiert. \r\n\r\n---\r\n\r\n#### Challenge \r\n\r\n- [Standort planung](https://hack.opendata.ch/project/281)\r\n\r\n#### Data\r\n\r\n- https://lemnet.org/\r\n- https://data.geo.admin.ch/ch.bfe.ladestellen-elektromobilitaet/data/ch.bfe.ladestellen-elektromobilitaet.json\r\n- https://www.bfs.admin.ch/bfs/de/home/statistiken/mobilitaet-verkehr/personenverkehr.html\r\n- Netzbetreiber Aargau\r\n- Park & Ride Aargau\r\n- Park & Pool Aargau\r\n- Parkpl\u00e4tze Tiefbauamt Kanton Aargau\r\n\r\n---\r\n\r\n\ud83d\udea7 **Under Construction** \ud83d\udea7\r\n\r\n","maintainer":"oleg","name":"Ladestationen-Standortplanung","phase":"Prototype","progress":30,"score":74,"source_url":"https://github.com/felixgantner/felixgantner.github.io","stats":{"commits":0,"during":23,"people":1,"sizepitch":2566,"sizetotal":2598,"total":24,"updates":22},"summary":"A view on the future of planning","team":"oleg, mefe","team_count":1,"updated_at":"2020-08-17T08:55","url":"https://hack.opendata.ch/project/342","webpage_url":"https://felixgantner.github.io/ladestationen_aargau.html"},{"autotext":"# PV-Potential on SBB-Areas\nThe goal of the project is to assess the PV-potential of areas owned by SBB. We use a dataset from SBB containing: Jahresverbrauch, Anschl\u00fcsse, and Geb\u00e4ude-shapes, for each address.\nOn this dataset we did a general potential analysis over all addresses.\nFor a more detailed assessment and visualization of potential \"Zussammenschl\u00fcsse\" of adjoining parcels we linked the SBB data with the swiss energy planning app of geoimpact which collects, links, and visualizes several open datasets (e.g., from Sonnendach, Elcom, ...)\n\n\n# General Potential Analysis\nPV-potential over all SBB-areas:\n\n**** 153 GWh (LCOE<10 Rp/kWh) --> 0.3% of total swiss electricity consumtion ****\n\n**** 270 GWh (LCOE<15 Rp/kWh) --> 0.5% of total swiss electricity consumtion ****\n\nCO2 reduction potential over all SBB-areas:\n\n**** ~7000 tons of CO2 reduction (LCOE<10 Rp/kWh) ****\n\n**** ~12000 tons of CO2 reduction (LCOE<15 Rp/kWh) ****\n\nFigure: Total electricity generation potential from PV: 130 GWh (LCOE<10 Rp/kWh), 270 GWh (LCOE<15 Rp/kWh). Ranking of Gemeinde by total potential area for PV installation (roof area that intersects and within the parcel):\n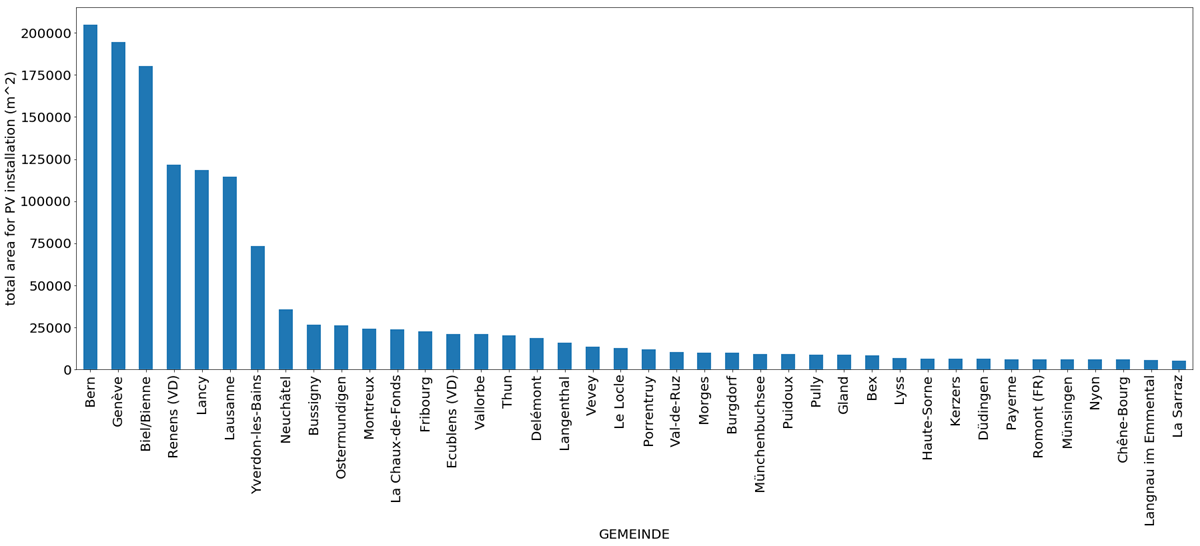\n\nFigure: Potential vs. PV LCOE for each parcel. With Gemeinde names where the parcel is located in. Parcels on on top left corner (high potential, low LCOE) shall be looked into:\n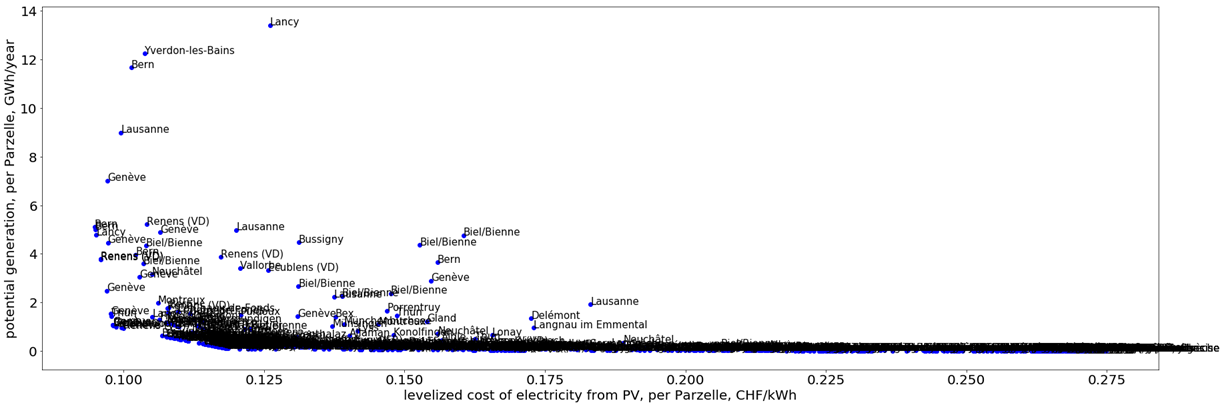\n\nData and code:\nhttps://github.com/magnetilo/max-pv-strom-sbb/blob/master/SBB%20ZEV%20-%20levelized%20cost%20of%20electricity.ipynb\n\n# Assessment and Visualization of parcels and potential \"Zusammenschl\u00fcsse zum Eigenverbrauch (ZEV)\"\nWhen you want to find ZEV you need to consider the geographic locations of the SBB-parcels, most importantly if two parcels are linked to each other through parcels that belong all to the same owner. In the case of SBB the ownership of train-track-parcels is especially interesting as they link different parcels over a large range (virtually over the whole country), which allows potentially for huge ZEV (see figure \"SBB Areale & M\u00f6glichkeiten ZEV\"). However, it is not clear yet if the connection across train tracks is physically feasible and makes economically sense.\n\n\n\nWe approach the assessment of the potential for ZEV with a qualitative model considering the aspects: \"Energie\", \"Wirtschaftlichkeit\", and \"Realisierbarkeit\". We divided our team into three subgroups working on the topics data, model, and visualization (see figure \"Teamaufteilung\").\n\n\n\nThe main task of the data team was the embedding of the SBB data into the swiss energy planning app, where several nasty problems arose.\n\nThe model team developed a qualitative model based on quantitative data for assessing the potential of each SBB parcel (or potentially any cluster of parcels, see figure \"Modell\").\n\n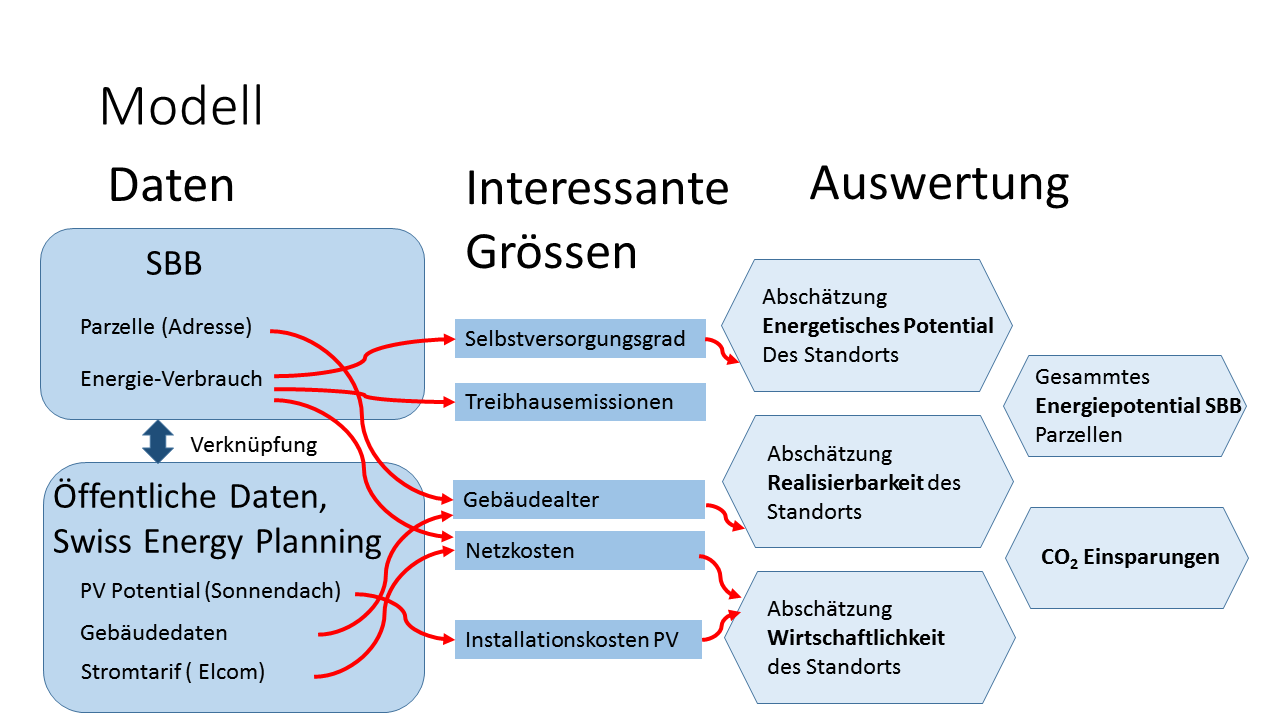\n\nFinally, we visualized the potential assessment and all the information of interest for each parcel on a interactive map in the swiss energy planning app (see figure \"Swiss Energy Planning\").\n\n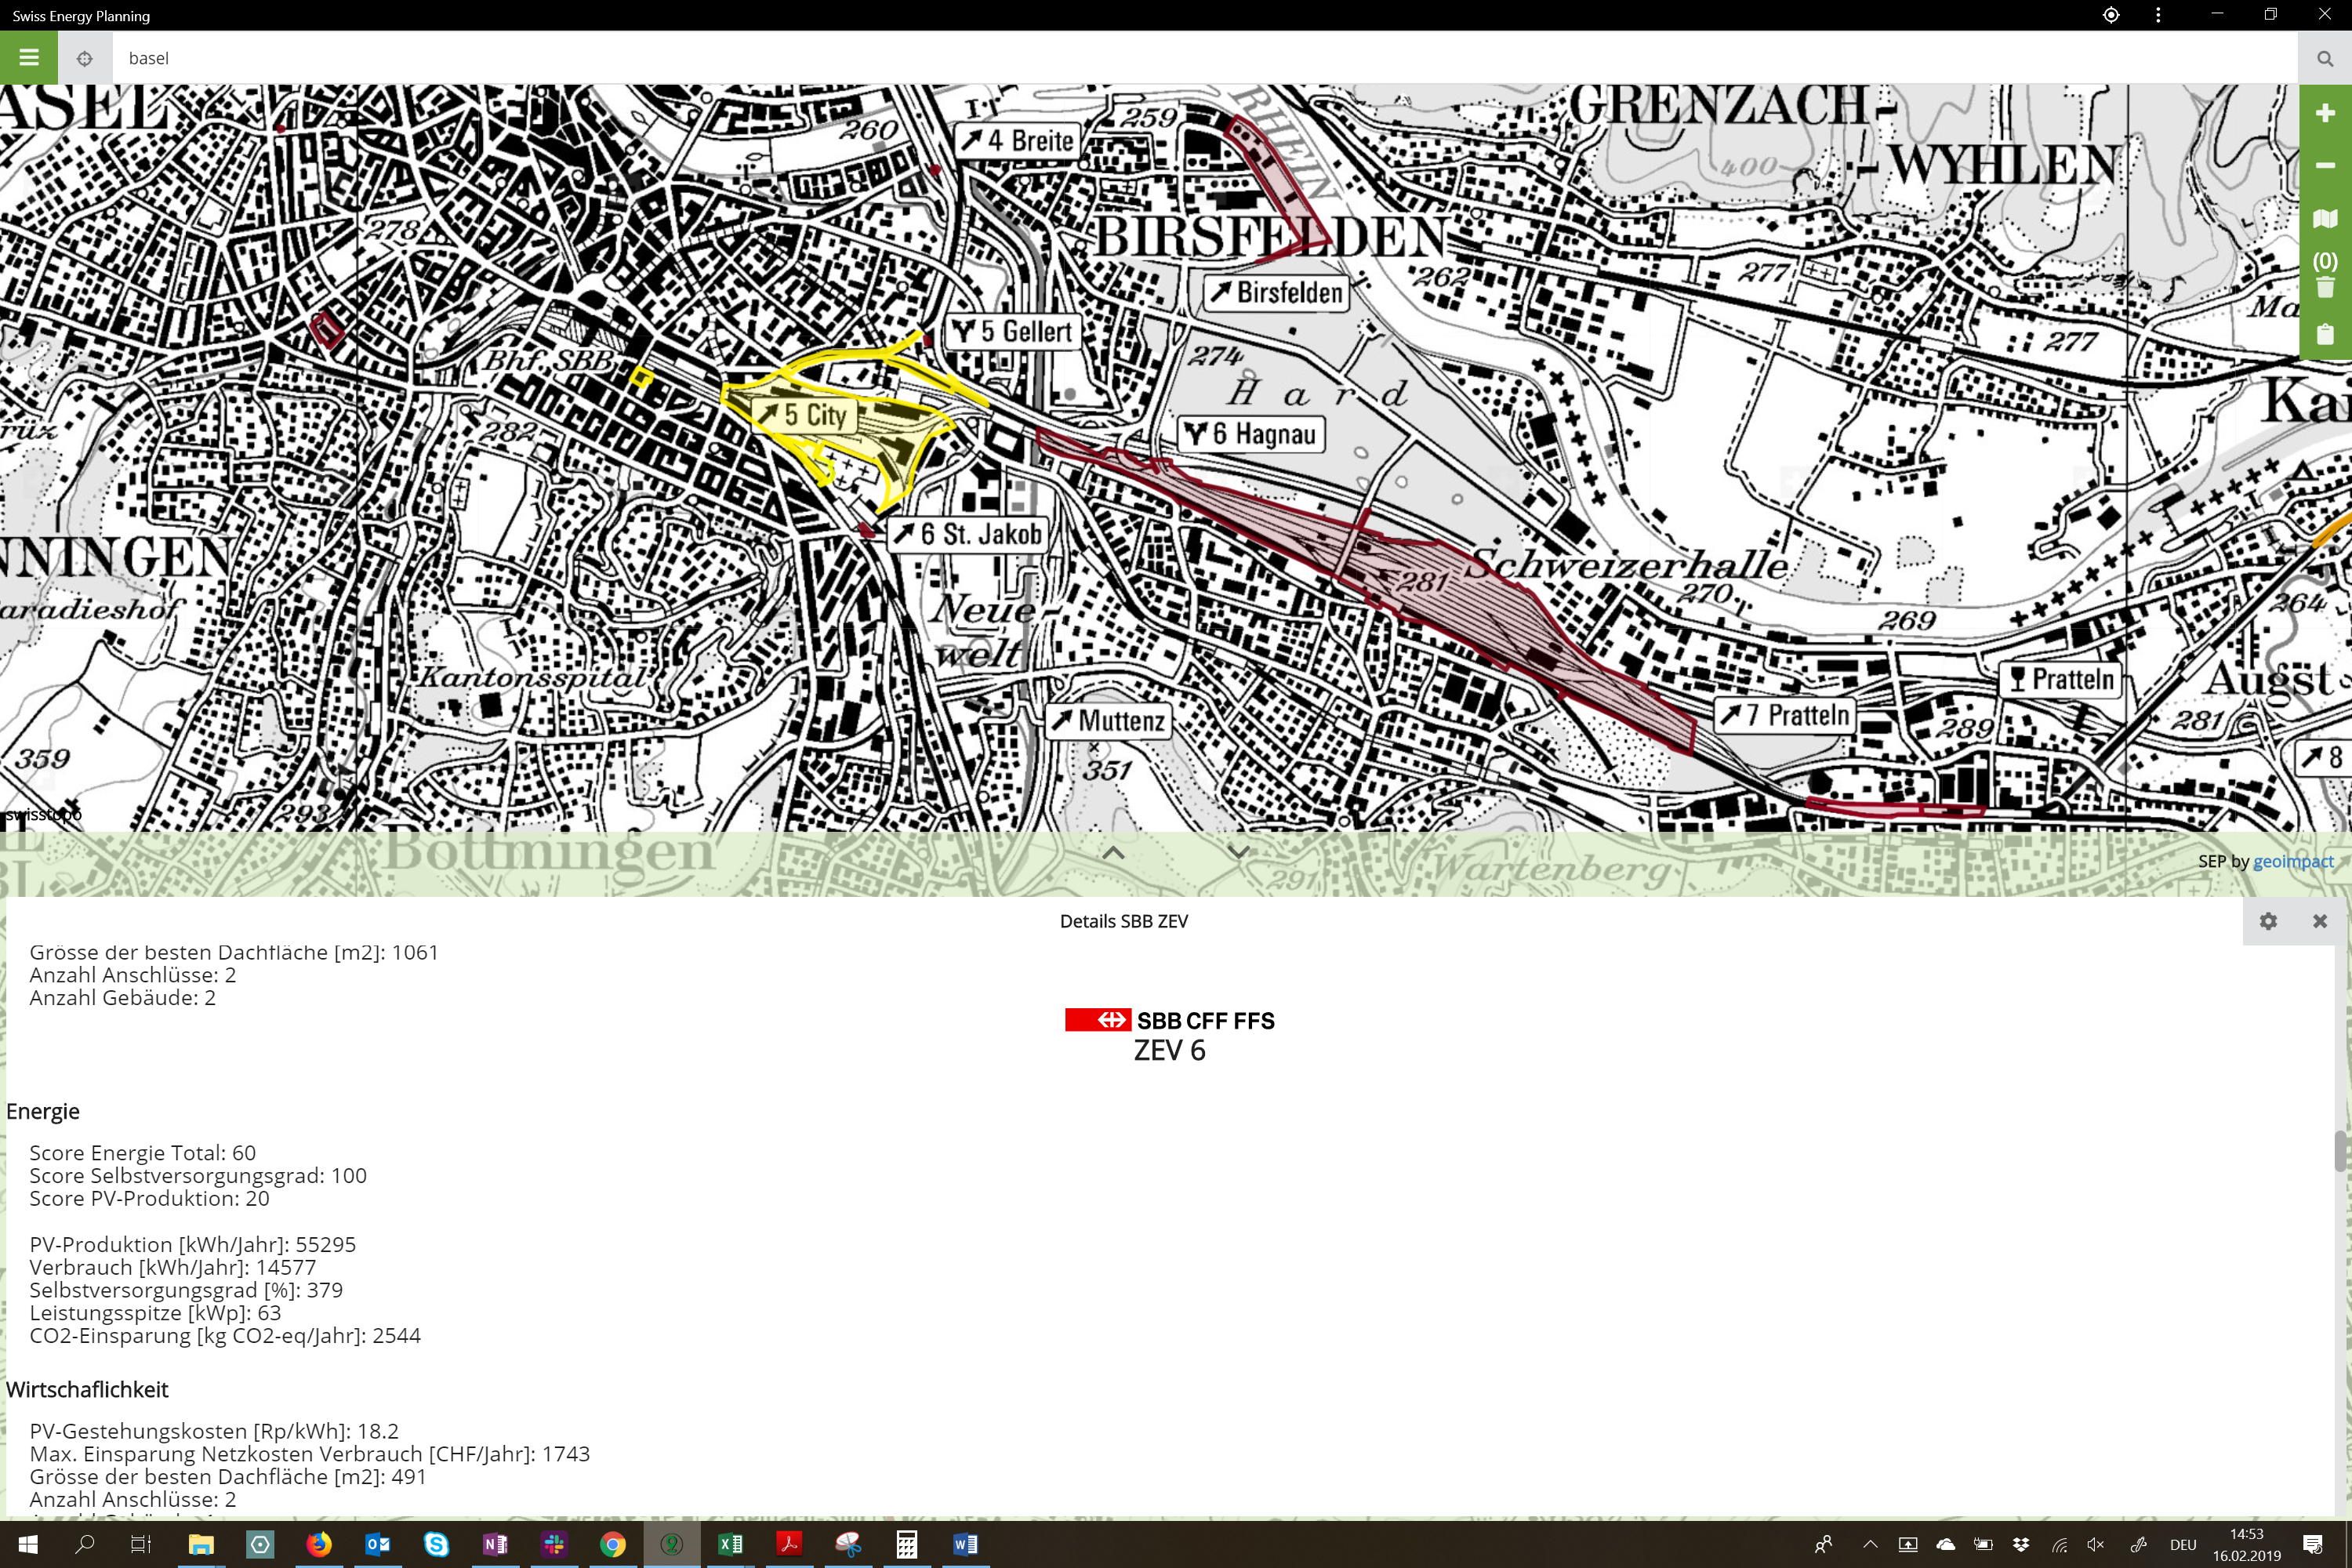\n","autotext_url":"https://github.com/magnetilo/max-pv-strom-sbb","category_id":32,"category_name":"Produktion","contact_url":"https://opendata-ch.slack.com/messages/CG85VQGTW","created_at":"2019-02-16T01:01","download_url":"","event_name":"Energy Data Hackdays 2019","event_url":"https://hack.opendata.ch/event/24","excerpt":"SBB ZEV aims to analyse the potential of different SBB buildings to become self-powering entities. In a second step, this evaluation will be visualised to make it more accessible.\r\n\r\n**Data & code:** Notebook\r\n\r\n**Challenge:** [Max PV-Strom SBB-Arealen](https://hack.opendata.ch/project/296)\r\n","hashtag":"","id":335,"ident":null,"image_url":"https://avatars3.githubusercontent.com/u/10993772?v=4","is_challenge":false,"is_webembed":true,"logo_color":"","logo_icon":"","longtext":"SBB ZEV aims to analyse the potential of different SBB buildings to become self-powering entities. In a second step, this evaluation will be visualised to make it more accessible.\r\n\r\n**Data & code:** Notebook\r\n\r\n**Challenge:** [Max PV-Strom SBB-Arealen](https://hack.opendata.ch/project/296)\r\n","maintainer":"oleg","name":"SBB ZEV","phase":"Sketching","progress":20,"score":70,"source_url":"https://github.com/magnetilo/max-pv-strom-sbb","stats":{"commits":0,"during":6,"people":2,"sizepitch":452,"sizetotal":4091,"total":14,"updates":11},"summary":"Visualize the potential of different SBB buildings as self-powering communities","team":"oleg, magnetilo, xiaojin.zhang","team_count":2,"updated_at":"2019-04-04T11:35","url":"https://hack.opendata.ch/project/335","webpage_url":"https://rawcdn.githack.com/magnetilo/max-pv-strom-sbb/ac80664d500fa12d6346137f4f980d31c76652a9/sep.png"},{"autotext":"","autotext_url":"","category_id":35,"category_name":"Mobilit\u00e4t","contact_url":"https://opendata-ch.slack.com/messages/CG7L6MC01","created_at":"2019-02-16T01:26","download_url":"","event_name":"Energy Data Hackdays 2019","event_url":"https://hack.opendata.ch/event/24","excerpt":"This team is analysing fresh SBB weather data.\r\n\r\n#### Challenge \r\n\r\n- [Welchen Einfluss hat das Wetter auf deine Zugfahrt? ](https://hack.opendata.ch/project/297)\r\n\r\n#### Data\r\n\r\nStatt teuer Wetter Daten einzukaufen, k\u00f6nnten die Daten vom Integrated Surface Database (ISD) des amerikanischen Wetterdienst bezogen werden. Enthalten sind hier die historischen Stundenwerte aller Wetterstationen weltweit. Die Daten sind frei verf\u00fcgbar. \r\n\r\n#### First Update\r\n\r\n_We are working with SBB weather data, d...","hashtag":"","id":345,"ident":null,"image_url":"","is_challenge":false,"is_webembed":true,"logo_color":"","logo_icon":"","longtext":"This team is analysing fresh SBB weather data.\r\n\r\n#### Challenge \r\n\r\n- [Welchen Einfluss hat das Wetter auf deine Zugfahrt? ](https://hack.opendata.ch/project/297)\r\n\r\n#### Data\r\n\r\nStatt teuer Wetter Daten einzukaufen, k\u00f6nnten die Daten vom Integrated Surface Database (ISD) des amerikanischen Wetterdienst bezogen werden. Enthalten sind hier die historischen Stundenwerte aller Wetterstationen weltweit. Die Daten sind frei verf\u00fcgbar. \r\n\r\n#### First Update\r\n\r\n_We are working with SBB weather data, did some wrangling and found some outliners which they were very thankful for - e.g. some trains which ran 1 km per second. The data is 2GB of 5 minute periods for one year, it's in a separate file to the track data. Still struggling with that, but we have some models we are planning, and ran some already on the data. We'll see what we can build by tomorrow._\r\n\r\n#### Energielast Tool\r\n\r\nF\u00fcr einen produktiven Einsatz bei den SBB k\u00f6nnten die Real-Time Daten von MeteoSchweiz (Open Data) eingebunden werden. Es k\u00f6nnte dann der Energieverbrauch berechnet werden. Ein sehr einfachen Prototype findet sich unter http://hackday.nemundo.ch","maintainer":"oleg","name":"sbbweather","phase":"Prototype","progress":30,"score":62,"source_url":"","stats":{"commits":0,"during":7,"people":2,"sizepitch":1134,"sizetotal":1193,"total":9,"updates":6},"summary":"What influence does the weather have on your train journey?","team":"oleg, urs_lang","team_count":2,"updated_at":"2019-02-19T11:31","url":"https://hack.opendata.ch/project/345","webpage_url":"https://hackday.nemundo.ch/"},{"autotext":"","autotext_url":"","category_id":34,"category_name":"Dienste & Kunden","contact_url":"https://opendata-ch.slack.com/messages/CG85BSGBU","created_at":"2019-02-16T01:23","download_url":"","event_name":"Energy Data Hackdays 2019","event_url":"https://hack.opendata.ch/event/24","excerpt":"Freestyle is an app that helps people use energy in time periods that are less burdened.\r\n\r\n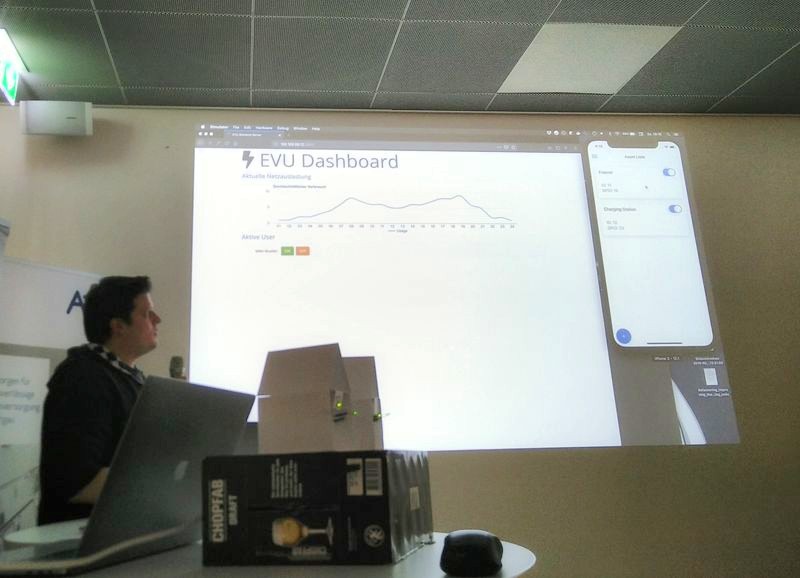\r\n\r\n> _Wir sind nur zu 3. Wir m\u00f6chten einen App machen zum Zeitperiode lenken die auf der Kurve nicht so belastet sind. Wir haben verschiedene Ger\u00e4te die nicht der ganzen Tag laufen m\u00fcssen. Unseren Tool soll erlauben EV einzugeben und plannen, und die Kurve abzugleichen. Gamification kommt darein. Wir sind daran die Infrastruktur aufz...","hashtag":"","id":343,"ident":null,"image_url":"https://avatars0.githubusercontent.com/u/2895704?s=460&v=4","is_challenge":false,"is_webembed":false,"logo_color":"","logo_icon":"","longtext":"Freestyle is an app that helps people use energy in time periods that are less burdened.\r\n\r\n\r\n\r\n> _Wir sind nur zu 3. Wir m\u00f6chten einen App machen zum Zeitperiode lenken die auf der Kurve nicht so belastet sind. Wir haben verschiedene Ger\u00e4te die nicht der ganzen Tag laufen m\u00fcssen. Unseren Tool soll erlauben EV einzugeben und plannen, und die Kurve abzugleichen. Gamification kommt darein. Wir sind daran die Infrastruktur aufzubauen, den App zu schreiben, schauen was passiert._\r\n\r\n---\r\n\r\n#### Challenge \r\n\r\n- [Gamification Verhalten](https://hack.opendata.ch/project/283)\r\n\r\n#### Code\r\n\r\n- https://github.com/lichtwellenreiter/eh_app\r\n- https://github.com/lichtwellenreiter/eh_evu\r\n- https://github.com/lichtwellenreiter/eh_haushalt\r\n\r\n ","maintainer":"oleg","name":"Freestyle","phase":"Prototype","progress":30,"score":61,"source_url":"https://github.com/lichtwellenreiter","stats":{"commits":0,"during":3,"people":0,"sizepitch":885,"sizetotal":914,"total":6,"updates":5},"summary":"Gamify your Electricity Usage","team":"oleg","team_count":0,"updated_at":"2019-02-25T22:29","url":"https://hack.opendata.ch/project/343","webpage_url":""},{"autotext":"","autotext_url":"","category_id":35,"category_name":"Mobilit\u00e4t","contact_url":"https://opendata-ch.slack.com/messages/CFPUZ7GKV","created_at":"2019-02-16T11:27","download_url":"","event_name":"Energy Data Hackdays 2019","event_url":"https://hack.opendata.ch/event/24","excerpt":"This project devises a fun way to investigate the equipment that people bring to a hackathon, and provoke conversation about energy usage and standards. \r\n\r\n# How to\r\n\r\n### 1. Bring a kitchen scale to the hackathon, or find one on location \r\n\r\n\r\n\r\n_(Thanks, Bernhard!)_\r\n\r\n_((The Micro:bit is just for decoration - bonus points for using a smart scale!))_\r\n\r\n### 2. Collect the data in some way. You can use our proto-app,...","hashtag":"","id":346,"ident":null,"image_url":"","is_challenge":false,"is_webembed":false,"logo_color":"","logo_icon":"","longtext":"This project devises a fun way to investigate the equipment that people bring to a hackathon, and provoke conversation about energy usage and standards. \r\n\r\n# How to\r\n\r\n### 1. Bring a kitchen scale to the hackathon, or find one on location \r\n\r\n\r\n\r\n_(Thanks, Bernhard!)_\r\n\r\n_((The Micro:bit is just for decoration - bonus points for using a smart scale!))_\r\n\r\n### 2. Collect the data in some way. You can use our proto-app, for instance.\r\n\r\n`-->` **[JamBricks App](https://blog.datalets.ch/workshops/2019/energy/jb/)** `<--`\r\n\r\n_NB:_ the data is not yet saved anywhere except on your own computer!\r\n\r\n### 3. Measure the **Weight** (in grams) of every participant's power supply and read the **Wattage** from the label.\r\n\r\nPro tip: if the Wattage is not stated, multiply the number of Volts by the Amps, e.g.:\r\n\r\n`19.5V x 3.34A ~= 65W`\r\n\r\n### 4. Copy and paste the resulting totals on your project page, and ask the other teams to do the same! \r\n\r\nFor example, you would get something like this:\r\n\r\n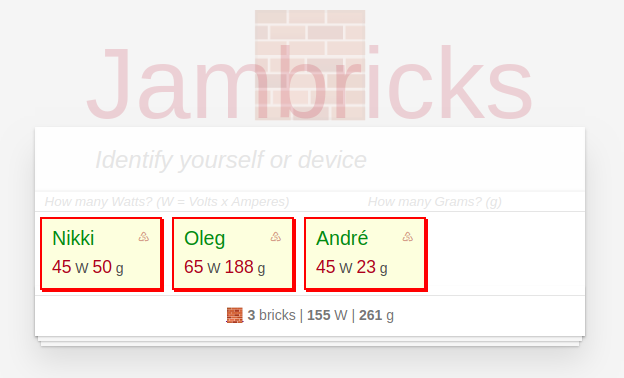\r\n\r\n# Show me the data\r\n\r\nYou can find a table of all of our [results from #energyhack19 here](https://gist.github.com/loleg/a7de098d5c5beed2f1e88dc98bc4af3b) (GitHub)\r\n\r\nWe dragged a total of **12.0 kg** of power supplies rated a total of **3'890 W** across all 59 people surveyed. Some people did not have a PSU and seemed to last the hackathon on a battery charge - _what's your secret?_\r\n\r\nCongratulations to Andreas for bringing the \"heavy\" to the Hackdays, a 435 g brick, which also is the highest rated we found at 148 W.\r\n\r\n### Wait, but why?\r\n\r\nLaptops and other mobile computing devices are a prerequisite of hackathons. You could support your team's design efforts with a pad of paper and pencil, and you should - but most people would feel left out if they came to a coding party without their devices. \r\n\r\nPeople bring all kinds of hardware to hackathons. Back in the days of the [LAN party](https://blog.datalets.ch/050/) we used to bring whole PCs and bulky monitors on site. These days we might do well to do our coding for the weekend on an tablet. In sports, people pay attention to the \"hardware\": the shape and size [of bicycles](https://www.cyclingweekly.com/news/latest-news/fabian-cancellaras-custom-2015-trek-domane-155811) or [skis](https://www.pugski.com/threads/rank-the-race-skis-in-order.2615/), for instance. \r\n\r\nWe have never thought about the power consumption figures of our computers before - but today the issues of the excessive energy consumption of IT projects is a topic of [public concern](https://www.wired.com/story/bitcoin-global-warming/) (WIRED). Some people complain about their heavy power supplies, and we started wondering why Smart Homes and Offices don't have DC plugs, and got into a bit of the history of (the lack of) electricity standards. \r\n\r\nWith this project we aim to provoke some conversation about an overlooked element that may contribute to successful collaboration. \r\n\r\n### Inspirational quote\r\n\r\n> _It would be quite possible to devise a universal DC outlet that depended on an ID signal from the device being supplied, either from its cable or the from the device. This only needs to be a unique ID. As we only need a small range of voltages, typically from 3V to 24V we wouldn\u2019t need a complex code. An intelligent adaptor in the outlet would then set the voltage needed by that device. In a way this is done already with the plug and socket combination identifying the voltage. This also shows up the weakness of a smart outlet. You only need a lightweight connector for a device drawing small currents (e.g. Micro-C USB), but something more substantial would be needed for devices like printers and monitors that might draw peak currents of two or three amps. Perhaps two different sockets, one for low, and one for high power would be acceptable._\r\n\r\n-- Rob Gillatt, Electronics Engineer via [Quora](https://www.quora.com/Why-arent-DC-power-outlets-built-into-the-wall-so-electronic-devices-wouldnt-require-an-AC-DC-converter)\r\n\r\n## Credits\r\n\r\nThe web application is made with [Vue.js](http://vuejs.org) based on the [TodoMVC](https://vuejs.org/v2/examples/todomvc.html) boilerplate. You can fork the source code at [JSFiddle](https://jsfiddle.net/loleg/npdxs52f/62/).\r\n\r\nInspired by crowdsourcing data from participants, by physical hackathon projects like [Aufschnitthilfe](https://hack.opendata.ch/project/26), and by midnight reading about the reasons we cannot plug our devices directly into wall sockets. \r\n\r\n\ud83e\uddf1 3 bricks | 155 W | 261 g","maintainer":"loleg","name":"Jambricks","phase":"Research","progress":10,"score":50,"source_url":"https://jsfiddle.net/loleg/npdxs52f/62/","stats":{"commits":0,"during":4,"people":1,"sizepitch":4810,"sizetotal":4845,"total":10,"updates":8},"summary":"Plug n' play on your hackathon way!","team":"loleg","team_count":1,"updated_at":"2019-02-19T11:55","url":"https://hack.opendata.ch/project/346","webpage_url":"https://blog.datalets.ch/workshops/2019/energy/jb/"},{"autotext":"","autotext_url":"","category_id":34,"category_name":"Dienste & Kunden","contact_url":"","created_at":"2018-12-21T16:03","download_url":"","event_name":"Energy Data Hackdays 2019","event_url":"https://hack.opendata.ch/event/24","excerpt":"Unterschiedliches Verbrauchsverhalten bei unterschiedlichen Kunden erfordert unterschiedliche Arten der Kommunikation und des Marketings.\r\n\r\nDie vollst\u00e4ndige Liberalisierung des Strommarktes wird mittelfristig f\u00fcr 700 Schweizer Versorgungsunternehmen zur Realit\u00e4t. Kundenbindung steht im Mittelpunkt.\r\n\r\nAnders als bei Retailern wie Migros und coop ist Big Data Analyse der Kundendaten im Energiebereich bisher ein sehr sensibles Thema.\r\n\r\nZiel w\u00e4re ein Tool, welches in einem gew\u00fcnschten Netzgebiet ...","hashtag":"","id":286,"ident":null,"image_url":"https://opendata.utou.ch/goodrollin/Q.php?F","is_challenge":true,"is_webembed":null,"logo_color":"","logo_icon":"","longtext":"Unterschiedliches Verbrauchsverhalten bei unterschiedlichen Kunden erfordert unterschiedliche Arten der Kommunikation und des Marketings.\r\n\r\nDie vollst\u00e4ndige Liberalisierung des Strommarktes wird mittelfristig f\u00fcr 700 Schweizer Versorgungsunternehmen zur Realit\u00e4t. Kundenbindung steht im Mittelpunkt.\r\n\r\nAnders als bei Retailern wie Migros und coop ist Big Data Analyse der Kundendaten im Energiebereich bisher ein sehr sensibles Thema.\r\n\r\nZiel w\u00e4re ein Tool, welches in einem gew\u00fcnschten Netzgebiet alle potenziellen Kunden nach ihren Energiedienstleistungsbed\u00fcrfnissen gruppiert. Der ethisch korrekte Umgang mit Kundendaten stellt eine Vielzahl von Herausforderungen dar und k\u00f6nnte in der Entwicklung dieses Tools auch Gegenstand der Untersuchung sein.\r\n\r\nWelche Kundengruppen gibt es? Welche Bed\u00fcrfnisse haben diese Kundengruppen tats\u00e4chlich? Wie sehen massgeschneiderte Angebote f\u00fcr die verschiedenen Kundengruppen aus? Wie kann ich unter Ber\u00fccksichtigung ethischer orientierungspunkte f\u00fcr Big Data Analysen die Effizienz der Werbemassnahmen verbessern?","maintainer":"oleg","name":"Kunden + Data","phase":"Challenge","progress":-1,"score":2,"source_url":"","stats":{"commits":0,"during":0,"people":2,"sizepitch":1057,"sizetotal":1107,"total":4,"updates":1},"summary":"Kundensegmentierung und die jeweiligen Bed\u00fcrfnisse","team":"oleg, derrickoswald, emilieboillat","team_count":2,"updated_at":"2019-02-12T12:57","url":"https://hack.opendata.ch/project/286","webpage_url":""},{"autotext":"","autotext_url":"","category_id":33,"category_name":"Netze","contact_url":"","created_at":"2018-12-18T13:15","download_url":"","event_name":"Energy Data Hackdays 2019","event_url":"https://hack.opendata.ch/event/24","excerpt":"#### \u00abSpielerische\u00bb Herausforderungen von Versorgungsunternehmen und ein optimierter Lastgang\r\n\r\nDie Energiewende spielt sich im Verteilnetz (beim Endkunden) ab. Dezentralisierung ist eine der drei Hauptherausforderungen (Digitalisierung, Dekarbonisierung, Dezentralisierung) der Energiebranche.\r\n\u00a0\r\nDie zuk\u00fcnftigen Anforderungen f\u00fchren zu Engp\u00e4ssen im Verteilnetz, so dass ein aktives Engpassmanagement eine dauerhafte Aufgabe eines Verteilnetzbetreibers sein wird. Der Einbezug von Flexibilit\u00e4ten v...","hashtag":"","id":282,"ident":null,"image_url":"https://opendata.utou.ch/goodrollin/Q.php?B","is_challenge":true,"is_webembed":false,"logo_color":"","logo_icon":"","longtext":"#### \u00abSpielerische\u00bb Herausforderungen von Versorgungsunternehmen und ein optimierter Lastgang\r\n\r\nDie Energiewende spielt sich im Verteilnetz (beim Endkunden) ab. Dezentralisierung ist eine der drei Hauptherausforderungen (Digitalisierung, Dekarbonisierung, Dezentralisierung) der Energiebranche.\r\n\u00a0\r\nDie zuk\u00fcnftigen Anforderungen f\u00fchren zu Engp\u00e4ssen im Verteilnetz, so dass ein aktives Engpassmanagement eine dauerhafte Aufgabe eines Verteilnetzbetreibers sein wird. Der Einbezug von Flexibilit\u00e4ten von Lasten und Speichern mit hohem Automatisierungsgrad sind notwendig.\r\n\u00a0\r\nWas braucht es, um eine ideale Lastgangkurve f\u00fcr ein EVU oder ein Netzgebiet zu modellieren, die \u00aballes\u00bb ber\u00fccksichtigt?\r\n\u00a0\r\nModellierung von Verbrauchern (Smart Homes) mit ihren Ger\u00e4ten und \u00abvirtuelle\u00bb Steuerung dieser Beispielhafte Ger\u00e4te: Elektromobile, Batterien im Keller und ihre durch Endkunden getriebenen Betriebsmodi, Licht, Fernseher, Heizung/W\u00e4rmepumpe, Warmwasserboiler, PV Anlagen, etc.\r\nWas m\u00fcssen die Ger\u00e4te k\u00f6nnen? Annahme ist, das IoT in gewissen Rahmen vorhanden ist.\r\n\u00a0\r\nAlternativ k\u00f6nnte anhand des Gamification-Ansatzes auch der Eigenverbrauch eines Einfamilienhauses spielerisch optimiert werden (z.B. Auswirkung Installation PV + Elektrofahrzeug, das auch als Batterie dient, auf die eigene Lastganzkurve aufzeigen).","maintainer":"oleg","name":"Gamification Lastgang","phase":"Challenge","progress":-1,"score":2,"source_url":"","stats":{"commits":0,"during":1,"people":1,"sizepitch":1315,"sizetotal":1351,"total":6,"updates":4},"summary":"Optimierte Lastgangkurve f\u00fcr ein EVU","team":"oleg, pascaaal","team_count":1,"updated_at":"2019-02-14T22:10","url":"https://hack.opendata.ch/project/282","webpage_url":""},{"autotext":"","autotext_url":"","category_id":33,"category_name":"Netze","contact_url":"","created_at":"2019-01-28T08:31","download_url":"","event_name":"Energy Data Hackdays 2019","event_url":"https://hack.opendata.ch/event/24","excerpt":"Im Zusammengang mit einem risiko-orientierten Ansatz f\u00fcr die Erneuerungsplanung werden Betriebsmittel im Bereich Niederspannung (Verteilkabinen, Leitungen) auf Grundlage von Wichtigkeits- und Zustandskriterien eingesch\u00e4tzt. Insbesondere die Wichtigkeit stellt die Versorger auf Grund von teilweise fehlenden betrieblichen Daten aber vor Herausforderungen. K\u00f6nnen anhand von vorliegenden Vergangenheitsdaten aus IT-Systemen (bspw. SAP, GIS) geeignete Kriterien zur Beurteilung der Wichtigkeit der Betr...","hashtag":"","id":301,"ident":null,"image_url":"https://opendata.utou.ch/goodrollin/Q.php?H","is_challenge":true,"is_webembed":false,"logo_color":"","logo_icon":"","longtext":"Im Zusammengang mit einem risiko-orientierten Ansatz f\u00fcr die Erneuerungsplanung werden Betriebsmittel im Bereich Niederspannung (Verteilkabinen, Leitungen) auf Grundlage von Wichtigkeits- und Zustandskriterien eingesch\u00e4tzt. Insbesondere die Wichtigkeit stellt die Versorger auf Grund von teilweise fehlenden betrieblichen Daten aber vor Herausforderungen. K\u00f6nnen anhand von vorliegenden Vergangenheitsdaten aus IT-Systemen (bspw. SAP, GIS) geeignete Kriterien zur Beurteilung der Wichtigkeit der Betriebsmittelgruppen (Verteilkabinen, Leitungen) definiert werden?\r\n\r\nWie k\u00f6nnte ein Datenmodell aussehen, mit dem ein systematischer Ansatz - bspw. welche Daten werden ben\u00f6tigt, wie werden die Daten miteinander kombiniert, welche Daten k\u00f6nnten eventuell in Zukunft einen m\u00f6glichen Beitrag leisten, etc. - f\u00fcr die Ermittlung einer Zustandsbeurteilung aussehen? Der Ansatz soll k\u00fcnftig unabh\u00e4ngig vom versorgten Gebiet und unabh\u00e4ngig von der Netztopologie (Stichwort vermaschtes oder sternf\u00f6rmiges Netz) angewendet werden k\u00f6nnen.","maintainer":"oleg","name":"Erneuerungs-planung","phase":"Challenge","progress":-1,"score":0,"source_url":"","stats":{"commits":0,"during":0,"people":1,"sizepitch":1025,"sizetotal":1064,"total":4,"updates":2},"summary":"Zustandsbeurteilung von Betriebsmitteln","team":"oleg","team_count":1,"updated_at":"2019-02-14T22:11","url":"https://hack.opendata.ch/project/301","webpage_url":""},{"autotext":"","autotext_url":"","category_id":34,"category_name":"Dienste & Kunden","contact_url":"","created_at":"2018-12-21T17:06","download_url":"","event_name":"Energy Data Hackdays 2019","event_url":"https://hack.opendata.ch/event/24","excerpt":"Sch\u00e4den an Infrastrukturen von Versorgungsunternehmen entstehen immer und \u00fcberall. Gr\u00f6ssere Sch\u00e4den k\u00f6nnen umgehend lokalisiert und entsprechend behoben werden. Kleinere Sch\u00e4den werden h\u00e4ufig nicht rechtzeitig erkannt und bergen so die Gefahr, dass aus ihnen grosse Sch\u00e4den werden.\r\n\r\nWie kann die Schnittstelle zwischen dem Einwohner und dem Versorgungsunternehmen f\u00fcr beide Seiten Mehrwertstiftend gestaltet werden? Worauf muss ich als EVU achten? Wie bekomme ich als EVU den B\u00fcrger dazu, dass sich...","hashtag":"","id":291,"ident":null,"image_url":"https://opendata.utou.ch/goodrollin/Q.php?L","is_challenge":true,"is_webembed":null,"logo_color":"","logo_icon":"","longtext":"Sch\u00e4den an Infrastrukturen von Versorgungsunternehmen entstehen immer und \u00fcberall. Gr\u00f6ssere Sch\u00e4den k\u00f6nnen umgehend lokalisiert und entsprechend behoben werden. Kleinere Sch\u00e4den werden h\u00e4ufig nicht rechtzeitig erkannt und bergen so die Gefahr, dass aus ihnen grosse Sch\u00e4den werden.\r\n\r\nWie kann die Schnittstelle zwischen dem Einwohner und dem Versorgungsunternehmen f\u00fcr beide Seiten Mehrwertstiftend gestaltet werden? Worauf muss ich als EVU achten? Wie bekomme ich als EVU den B\u00fcrger dazu, dass sich dieser aktiv beteiligt? Was ist dem Kunden wichtig? Wie kann ich diese Schnittstelle gestalten, damit ich ggf. auch Zugang zum Kunden bekomme? Welche M\u00f6glichkeiten f\u00fcr einen Anreiz gibt es? Wie kann/sollte ein erkannter Defekt kommuniziert werden?\r\n\r\n**Unterst\u00fctzt Gamification die Partizipation und Kommunikation?**\r\n\r\nWie kann mittels Gamification ein zus\u00e4tzlicher Anreiz zur Partizipation und Kommunikation zwischen Endkunden und Versorgungsunternehmen geschaffen werden?","maintainer":"oleg","name":"B\u00fcrger-partizipation","phase":"Challenge","progress":-1,"score":0,"source_url":"","stats":{"commits":0,"during":0,"people":0,"sizepitch":975,"sizetotal":1001,"total":2,"updates":1},"summary":"Kommunikation Endkunde-EVU","team":"oleg","team_count":0,"updated_at":"2019-02-12T13:04","url":"https://hack.opendata.ch/project/291","webpage_url":""},{"autotext":"","autotext_url":"","category_id":35,"category_name":"Mobilit\u00e4t","contact_url":"","created_at":"2018-12-21T17:15","download_url":"","event_name":"Energy Data Hackdays 2019","event_url":"https://hack.opendata.ch/event/24","excerpt":"Der Energieverbrauch einer Zugfahrt h\u00e4ngt von vielen verschiedenen Einflussgr\u00f6ssen ab und kann stark variieren. Die Gesamtmasse, Streckenl\u00e4nge, Topologie (insbesondere Steigungen, Tunnel), der Geschwindigkeitsverlauf, Fahrzeugtechnik und nicht zuletzt die meteorologischen Umgebungsbedingungen sind die dominierenden Gr\u00f6ssen. Beim Wetter hat z.B. der Wind einen Einfluss auf die Traktionsenergie der Triebfahrzeuge und die Umgebungstemperatur hat einen Einfluss auf die ben\u00f6tigte Heiz- oder K\u00fchlenerg...","hashtag":"","id":297,"ident":null,"image_url":"https://opendata.utou.ch/goodrollin/Q.php?S","is_challenge":true,"is_webembed":false,"logo_color":"","logo_icon":"","longtext":"Der Energieverbrauch einer Zugfahrt h\u00e4ngt von vielen verschiedenen Einflussgr\u00f6ssen ab und kann stark variieren. Die Gesamtmasse, Streckenl\u00e4nge, Topologie (insbesondere Steigungen, Tunnel), der Geschwindigkeitsverlauf, Fahrzeugtechnik und nicht zuletzt die meteorologischen Umgebungsbedingungen sind die dominierenden Gr\u00f6ssen. Beim Wetter hat z.B. der Wind einen Einfluss auf die Traktionsenergie der Triebfahrzeuge und die Umgebungstemperatur hat einen Einfluss auf die ben\u00f6tigte Heiz- oder K\u00fchlenergie.\r\n\r\nDank verbesserter Kenntnis der Anteile einzelner Einflussgr\u00f6ssen am Gesamtenergieverbrauch k\u00f6nnen z.B. Energiesparmassnahmen identifiziert und umgesetzt werden oder bessere Leistungsprognosen von Zugfahrten erstellt werden (Lastmanagement bei SBB).\r\n \r\nEine detaillierte physikalische Modellierung der Witterungseinfl\u00fcsse ist sehr aufw\u00e4ndig. Ist es m\u00f6glich, mittels Machine Learning in einem vereinfachten Modell die wesentlichen Komponenten abzubilden und so die Prognose des Energieverbrauchs von Zugfahrten zu verbessern?\r\n\r\nF\u00fcr zwei ausgew\u00e4hlten Strecken (jeweils beide Richtungen) mit bestimmten Triebz\u00fcgen werden Verbrauchswerte und Meteodaten zur Verf\u00fcgung gestellt.\r\n\r\nIm Rahmen der Aufgabenstellung soll mit einem vereinfachten Modell gestartet werden, das zu Beginn den Einfluss eines Witterungsparameters (z.B. Umgebungstemperaturen) ber\u00fccksichtigt und sp\u00e4ter erweitert wird.","maintainer":"oleg","name":"Welchen Einfluss hat das Wetter auf deine Zugfahrt?","phase":"Challenge","progress":-1,"score":0,"source_url":"","stats":{"commits":0,"during":0,"people":1,"sizepitch":1393,"sizetotal":1510,"total":11,"updates":9},"summary":"Mittels Machine Learning den Einfluss der Umgebungsbedingungen auf den Energieverbrauch von Zugfahrten quantifizieren","team":"oleg, rschaefer","team_count":1,"updated_at":"2019-02-15T08:40","url":"https://hack.opendata.ch/project/297","webpage_url":""},{"autotext":"","autotext_url":"","category_id":34,"category_name":"Dienste & Kunden","contact_url":"","created_at":"2018-12-21T17:10","download_url":"","event_name":"Energy Data Hackdays 2019","event_url":"https://hack.opendata.ch/event/24","excerpt":"Bauherren und Investoren sind nur bedingt vertraut mit dem energetischen Umfeld des neuen Baulandes.\r\n\r\nDurch eine Energiekarte k\u00f6nnten Bauherren die Strom- und W\u00e4rmeversorgung entsprechend der Rahmenbedingungen des Baulandes (Gemeinde) und gem\u00e4ss den Bed\u00fcrfnissen optimieren. Sonneneinstrahlung auf der Parzelle, bestehende W\u00e4rme- und m\u00f6gliche Abw\u00e4rmequellen. Das Ziel sollte eine ganzheitliche Betrachtungsweise des Planungstools sein, die Sanierungsm\u00f6glichkeiten aufzeigt","hashtag":"","id":293,"ident":null,"image_url":"https://opendata.utou.ch/goodrollin/Q.php?N","is_challenge":true,"is_webembed":null,"logo_color":"","logo_icon":"","longtext":"Bauherren und Investoren sind nur bedingt vertraut mit dem energetischen Umfeld des neuen Baulandes.\r\n\r\nDurch eine Energiekarte k\u00f6nnten Bauherren die Strom- und W\u00e4rmeversorgung entsprechend der Rahmenbedingungen des Baulandes (Gemeinde) und gem\u00e4ss den Bed\u00fcrfnissen optimieren. Sonneneinstrahlung auf der Parzelle, bestehende W\u00e4rme- und m\u00f6gliche Abw\u00e4rmequellen. Das Ziel sollte eine ganzheitliche Betrachtungsweise des Planungstools sein, die Sanierungsm\u00f6glichkeiten aufzeigt","maintainer":"oleg","name":"Energieatlas","phase":"Challenge","progress":-1,"score":0,"source_url":"","stats":{"commits":0,"during":0,"people":0,"sizepitch":474,"sizetotal":500,"total":2,"updates":1},"summary":"Energieatlas f\u00fcr Bauherren","team":"oleg","team_count":0,"updated_at":"2019-02-12T12:59","url":"https://hack.opendata.ch/project/293","webpage_url":""},{"autotext":"","autotext_url":"","category_id":32,"category_name":"Produktion","contact_url":"","created_at":"2018-12-21T17:14","download_url":"","event_name":"Energy Data Hackdays 2019","event_url":"https://hack.opendata.ch/event/24","excerpt":"Wie schafft man es im Fall der SBB basierend auf den gesetzlichen M\u00f6glichkeiten, m\u00f6glichst grosse Areale zu identifizieren, die eine hohe Eignung f\u00fcr Stromerzeugung mittels Photovoltaik haben?\r\n\r\nDer Zusammenschluss zum Eigenverbrauch (ZEV) (neue gesetzliche Grundlage) bietet die M\u00f6glichkeit, dass die SBB vor Ort produzierte elektrische Energie in erster Priorit\u00e4t direkt nutzen kann - wenn Bedingungen erf\u00fcllt sind:\r\nDie PV-Anlage liegt hinter dem gleichen Netzanschluss wie die Verbraucher. Ein E...","hashtag":"","id":296,"ident":null,"image_url":"https://opendata.utou.ch/goodrollin/Q.php?R","is_challenge":true,"is_webembed":null,"logo_color":"","logo_icon":"","longtext":"Wie schafft man es im Fall der SBB basierend auf den gesetzlichen M\u00f6glichkeiten, m\u00f6glichst grosse Areale zu identifizieren, die eine hohe Eignung f\u00fcr Stromerzeugung mittels Photovoltaik haben?\r\n\r\nDer Zusammenschluss zum Eigenverbrauch (ZEV) (neue gesetzliche Grundlage) bietet die M\u00f6glichkeit, dass die SBB vor Ort produzierte elektrische Energie in erster Priorit\u00e4t direkt nutzen kann - wenn Bedingungen erf\u00fcllt sind:\r\nDie PV-Anlage liegt hinter dem gleichen Netzanschluss wie die Verbraucher. Ein Eigenverbrauch liegt vor, wenn der produzierte Strom auf dem Weg zum Verbraucher nicht \u00fcber Verteilnetz des Energieversorgers fliest. Und die Produktionsleistung der PV-Anlage liegt bei mindestens 10 Prozent der Anschlussleistung des Zusammenschlusses. Damit k\u00f6nnen die Geb\u00fchren der Netznutzung eingespart werden.\r\n","maintainer":"oleg","name":"Max PV-Strom SBB-Arealen","phase":"Challenge","progress":-1,"score":0,"source_url":"","stats":{"commits":0,"during":0,"people":1,"sizepitch":812,"sizetotal":931,"total":6,"updates":4},"summary":"Zusammenh\u00e4nge SBB Parzellen mittels GIS-Daten so zusammenschliessen, dass Solarpotenziale optimal genutzt werden k\u00f6nnen","team":"oleg, mruecker","team_count":1,"updated_at":"2019-02-13T15:14","url":"https://hack.opendata.ch/project/296","webpage_url":""},{"autotext":"","autotext_url":"","category_id":33,"category_name":"Netze","contact_url":"","created_at":"2018-12-18T13:14","download_url":"","event_name":"Energy Data Hackdays 2019","event_url":"https://hack.opendata.ch/event/24","excerpt":"Basierend auf Mikrozensusdaten ist in meinem Netzgebiet mit wie vielen eigenen und geteilten Fahrzeugen zu rechnen.\r\n\r\nVor dem Hintergrund einer zunehmenden Anzahl an neu zugelassenen Elektrofahrzeugen im Markt, einer Anpassung der Batteriekapazit\u00e4ten, einer Ver\u00e4nderung des Ladeverhaltens (public, home, office) stellt sich die Frage nach den zuk\u00fcnftigen lukrativen Stellpl\u00e4tzen. Welche Rolle spielen Verkehrsfl\u00fcsse und t\u00e4gliche Bewegungen von Personen und Fahrzeugen bei der Findung lukrativer Stel...","hashtag":"","id":281,"ident":null,"image_url":"https://opendata.utou.ch/goodrollin/Q.php?A","is_challenge":true,"is_webembed":null,"logo_color":"","logo_icon":"","longtext":"Basierend auf Mikrozensusdaten ist in meinem Netzgebiet mit wie vielen eigenen und geteilten Fahrzeugen zu rechnen.\r\n\r\nVor dem Hintergrund einer zunehmenden Anzahl an neu zugelassenen Elektrofahrzeugen im Markt, einer Anpassung der Batteriekapazit\u00e4ten, einer Ver\u00e4nderung des Ladeverhaltens (public, home, office) stellt sich die Frage nach den zuk\u00fcnftigen lukrativen Stellpl\u00e4tzen. Welche Rolle spielen Verkehrsfl\u00fcsse und t\u00e4gliche Bewegungen von Personen und Fahrzeugen bei der Findung lukrativer Stellpl\u00e4tze im eigenen Netzgebiet? Anzahl und Entwicklung der Fahrzeuge im Markt.\r\n\r\nWas sind entscheidende Faktoren dar\u00fcber, weshalb manche Stationen wirtschaftlich sind, w\u00e4hrend die meisten bisher installierten Ladestationen eher Werbezwecken dienen? Was ist der maximale Leistungsbezug (in kW) welcher sich dort ergeben kann?","maintainer":"oleg","name":"Standort planung","phase":"Challenge","progress":-1,"score":0,"source_url":"","stats":{"commits":0,"during":0,"people":0,"sizepitch":824,"sizetotal":849,"total":5,"updates":4},"summary":"Netzplanung Ladestationen","team":"oleg","team_count":0,"updated_at":"2019-02-12T12:56","url":"https://hack.opendata.ch/project/281","webpage_url":""},{"autotext":"","autotext_url":"","category_id":33,"category_name":"Netze","contact_url":"","created_at":"2018-12-21T17:05","download_url":"","event_name":"Energy Data Hackdays 2019","event_url":"https://hack.opendata.ch/event/24","excerpt":"Das Ziel des [Feldversuches VEiN](http://www.vein-grid.ch/projekt.html) war es, die Auswirkungen der vermehrten dezentralen Einspeisung auf die Netzqualit\u00e4t und auf den Betrieb von Niederspannungsnetzen in der Praxis zu ermitteln. Zudem diente das Projekt VEiN auch als Plattform f\u00fcr wissenschaftliche Versuche bez\u00fcglich der dezentralen Stromerzeugung.\r\n\r\nIm Rahmen des Projektes wurden viele Daten gesammelt und einige Erkenntnisse gewonnen. Welche Erkenntnisse ziehen die \u00abHacker\u00bb aus diesen Daten ...","hashtag":"","id":290,"ident":null,"image_url":"https://opendata.utou.ch/goodrollin/Q.php?K","is_challenge":true,"is_webembed":null,"logo_color":"","logo_icon":"","longtext":"Das Ziel des [Feldversuches VEiN](http://www.vein-grid.ch/projekt.html) war es, die Auswirkungen der vermehrten dezentralen Einspeisung auf die Netzqualit\u00e4t und auf den Betrieb von Niederspannungsnetzen in der Praxis zu ermitteln. Zudem diente das Projekt VEiN auch als Plattform f\u00fcr wissenschaftliche Versuche bez\u00fcglich der dezentralen Stromerzeugung.\r\n\r\nIm Rahmen des Projektes wurden viele Daten gesammelt und einige Erkenntnisse gewonnen. Welche Erkenntnisse ziehen die \u00abHacker\u00bb aus diesen Daten die auch f\u00fcr ein anderes Netzgebiet relevant sind?\r\n\r\nGleiche Daten, anderes Ergebnis? \u2013 Was bringt ein Perspektivwechsel?","maintainer":"oleg","name":"What do you see 2.0","phase":"Challenge","progress":-1,"score":0,"source_url":"","stats":{"commits":0,"during":0,"people":1,"sizepitch":622,"sizetotal":664,"total":3,"updates":1},"summary":"Dezentralen Einspeisung und Stromerzeugung","team":"oleg, derrickoswald","team_count":1,"updated_at":"2019-02-12T12:59","url":"https://hack.opendata.ch/project/290","webpage_url":""},{"autotext":"","autotext_url":"","category_id":34,"category_name":"Dienste & Kunden","contact_url":"","created_at":"2018-12-21T17:03","download_url":"","event_name":"Energy Data Hackdays 2019","event_url":"https://hack.opendata.ch/event/24","excerpt":"Schweizer Endkunden haben einen eher abstrakten Bezug zum Strom in ihrem Haushalt. \u00abStrom kommt aus der Steckdose\u00bb und das 24/7\u2026.eine Selbstverst\u00e4ndlichkeit. Wirklich?\r\n\r\nWas braucht es, um Strom sichtbarer und/oder pr\u00e4senter f\u00fcr den Endkunden zu machen? Kann man \u00abStrom\u00bb sexier\u00bb machen? Applikationen f\u00fcr den Haushalt? Gamification-Ans\u00e4tze oder spielerische Konkurrenz k\u00f6nnten ein L\u00f6sungsansatz sein. Aber wie gestaltet?\r\n\r\nWas braucht es Eurer Meinung nach, um die \u00abSchl\u00fcsselenergie der Zukunft\u00bb be...","hashtag":"","id":289,"ident":null,"image_url":"https://opendata.utou.ch/goodrollin/Q.php?J","is_challenge":true,"is_webembed":false,"logo_color":"","logo_icon":"","longtext":"Schweizer Endkunden haben einen eher abstrakten Bezug zum Strom in ihrem Haushalt. \u00abStrom kommt aus der Steckdose\u00bb und das 24/7\u2026.eine Selbstverst\u00e4ndlichkeit. Wirklich?\r\n\r\nWas braucht es, um Strom sichtbarer und/oder pr\u00e4senter f\u00fcr den Endkunden zu machen? Kann man \u00abStrom\u00bb sexier\u00bb machen? Applikationen f\u00fcr den Haushalt? Gamification-Ans\u00e4tze oder spielerische Konkurrenz k\u00f6nnten ein L\u00f6sungsansatz sein. Aber wie gestaltet?\r\n\r\nWas braucht es Eurer Meinung nach, um die \u00abSchl\u00fcsselenergie der Zukunft\u00bb beim Endkunden bewusster zu machen?","maintainer":"oleg","name":"Visistrom challenge","phase":"Challenge","progress":-1,"score":0,"source_url":"","stats":{"commits":0,"during":2,"people":1,"sizepitch":533,"sizetotal":562,"total":4,"updates":2},"summary":"\u00abDem Strom ein Gesicht geben\u00bb","team":"oleg, emilieboillat","team_count":1,"updated_at":"2019-02-16T01:05","url":"https://hack.opendata.ch/project/289","webpage_url":""},{"autotext":"","autotext_url":"","category_id":34,"category_name":"Dienste & Kunden","contact_url":"","created_at":"2018-12-18T13:16","download_url":"","event_name":"Energy Data Hackdays 2019","event_url":"https://hack.opendata.ch/event/24","excerpt":"Crowd-Energy & Peer-to-Peer-Modelle gelten als Enabler f\u00fcr Gesch\u00e4ftsmodelle der dezentralen Energieproduktion \r\n\r\n\u00dcber Gamification und die Nutzung von mobilen Applikationen und Social Media kann die Generation der Digital Natives in neuen Gesch\u00e4ftsmodellen involviert werden\r\n\r\nDie Endkunden in der Schweiz haben einen eher abstrakten Bezug zum Strom in ihrem Haushalt. Durch ihr Verhalten haben sie aber einen grossen Einfluss auf den Verbrauch und k\u00f6nnen Flexibilit\u00e4t zur Verf\u00fcgung stellen\r\n\r\nMitt...","hashtag":"","id":283,"ident":null,"image_url":"https://opendata.utou.ch/goodrollin/Q.php?C","is_challenge":true,"is_webembed":false,"logo_color":"","logo_icon":"","longtext":"Crowd-Energy & Peer-to-Peer-Modelle gelten als Enabler f\u00fcr Gesch\u00e4ftsmodelle der dezentralen Energieproduktion \r\n\r\n\u00dcber Gamification und die Nutzung von mobilen Applikationen und Social Media kann die Generation der Digital Natives in neuen Gesch\u00e4ftsmodellen involviert werden\r\n\r\nDie Endkunden in der Schweiz haben einen eher abstrakten Bezug zum Strom in ihrem Haushalt. Durch ihr Verhalten haben sie aber einen grossen Einfluss auf den Verbrauch und k\u00f6nnen Flexibilit\u00e4t zur Verf\u00fcgung stellen\r\n\r\nMittels einer App (Game, Notifications, was auch immer) k\u00f6nnte man den Kunden dazu bewegen sich netzdienlicher (oder systemdienlich) zu Verhalten und ihm auch transparent aufzeigen, was sein Nutzen durch z.B. tiefere Preise ist. Was w\u00e4re hier ein m\u00f6glicher Ansatz?\r\n\r\nAnhand von Wettervorhersagen kann die saubere Produktion im Voraus bewertet und festgestellt werden, ob es rentabler ist, die Batterie aufzuladen, den Strom an den Stromversorger weiterzuverkaufen oder zu diesem Zeitpunkt vor Ort zu verbrauchen\r\n\r\nImmer wichtigere Rolle des Endkunden bei voranschreitender Dezentralisierung der Energielandschaft\r\n\r\n**Wie sieht eine erfolgsversprechende L\u00f6sung aus, mit der ich vom Solarstrom oder dem Stromspeicher meines Nachbarn profitieren kann? Kann ich durch Absprache des Verbrauchs mit meinen Nachbarn einen besseren Strompreis erzielen? L\u00e4sst durch Machine-Learning ein System bereitstellen, dass dem Anwender aktiv Optimierungsvorschl\u00e4ge macht?**","maintainer":"oleg","name":"Gamification Verhalten","phase":"Challenge","progress":-1,"score":0,"source_url":"","stats":{"commits":0,"during":0,"people":1,"sizepitch":1454,"sizetotal":1511,"total":5,"updates":3},"summary":"Energiemanagement f\u00fcr Prosumer/Flexibistrom/Quartierstrom","team":"oleg, derrickoswald","team_count":1,"updated_at":"2019-02-14T22:11","url":"https://hack.opendata.ch/project/283","webpage_url":""},{"autotext":"","autotext_url":"","category_id":32,"category_name":"Produktion","contact_url":"","created_at":"2018-12-18T13:19","download_url":"","event_name":"Energy Data Hackdays 2019","event_url":"https://hack.opendata.ch/event/24","excerpt":"\u00a0Bei Grossanlagen zur Erzeugung erneuerbarer Energien wird die Produktionsleistung regelm\u00e4ssig \u00fcberpr\u00fcft, um den ROI zu gew\u00e4hrleisten. Anders bei Kleinanlagen!\r\n\u00a0\r\nEin Vergleich der prognostizierten Produktion auf der Grundlage vergangener meteorologischer Daten mit der tats\u00e4chlichen Produktion einer Solar- oder Windkraftanlage erm\u00f6glicht es, abzusch\u00e4tzen, ob eine Anlage fehlerhaft ist.\r\n\u00a0\r\nDies beschleunigt die Diagnose und begrenzt die mit einer Anlagefehlfunktion verbundenen wirtschaftlichen ...","hashtag":"","id":284,"ident":null,"image_url":"https://opendata.utou.ch/goodrollin/Q.php?D","is_challenge":true,"is_webembed":false,"logo_color":"","logo_icon":"","longtext":"\u00a0Bei Grossanlagen zur Erzeugung erneuerbarer Energien wird die Produktionsleistung regelm\u00e4ssig \u00fcberpr\u00fcft, um den ROI zu gew\u00e4hrleisten. Anders bei Kleinanlagen!\r\n\u00a0\r\nEin Vergleich der prognostizierten Produktion auf der Grundlage vergangener meteorologischer Daten mit der tats\u00e4chlichen Produktion einer Solar- oder Windkraftanlage erm\u00f6glicht es, abzusch\u00e4tzen, ob eine Anlage fehlerhaft ist.\r\n\u00a0\r\nDies beschleunigt die Diagnose und begrenzt die mit einer Anlagefehlfunktion verbundenen wirtschaftlichen Verluste.\r\n\u00a0\r\nApproach and visualization is requested \u2013 **Can you handle it?**","maintainer":"oleg","name":"Photovolatik-Diagnose","phase":"Challenge","progress":-1,"score":0,"source_url":"","stats":{"commits":0,"during":0,"people":2,"sizepitch":577,"sizetotal":629,"total":5,"updates":2},"summary":"Erkennung von Fehlfunktionen in kleinen Solaranlagen","team":"oleg, urs_lang, emilieboillat","team_count":2,"updated_at":"2019-02-14T22:10","url":"https://hack.opendata.ch/project/284","webpage_url":""},{"autotext":"","autotext_url":"","category_id":34,"category_name":"Dienste & Kunden","contact_url":"","created_at":"2018-12-21T17:34","download_url":"","event_name":"Energy Data Hackdays 2019","event_url":"https://hack.opendata.ch/event/24","excerpt":"`-->` **[PROJECT PAGE](https://hack.opendata.ch/project/344)**\r\n\r\n## Challenge description\r\n\r\nZiel von *What is Watt* ist es, alles mit allem zu vergleichen. Wie viel Energie verbraucht meine t\u00e4gliche Pendler-Zugfahrt? (12.8 kWh) Und wie oft kann ich mit dieser Energie heiss duschen? (9 Mal) Oder einen Stock mit dem Lift fahren? (1200 Mal) Es bleibt am Ende die Entscheidung der einzelnen Person, ob sie nun n\u00e4her zu ihrem Arbeitsort zieht oder weniger lang/heiss duscht, um Energie zu sparen. \r\n\r\n...","hashtag":"","id":299,"ident":null,"image_url":"https://opendata.utou.ch/goodrollin/Q.php?T","is_challenge":true,"is_webembed":false,"logo_color":"#eff8ff","logo_icon":"balance-scale","longtext":"`-->` **[PROJECT PAGE](https://hack.opendata.ch/project/344)**\r\n\r\n## Challenge description\r\n\r\nZiel von *What is Watt* ist es, alles mit allem zu vergleichen. Wie viel Energie verbraucht meine t\u00e4gliche Pendler-Zugfahrt? (12.8 kWh) Und wie oft kann ich mit dieser Energie heiss duschen? (9 Mal) Oder einen Stock mit dem Lift fahren? (1200 Mal) Es bleibt am Ende die Entscheidung der einzelnen Person, ob sie nun n\u00e4her zu ihrem Arbeitsort zieht oder weniger lang/heiss duscht, um Energie zu sparen. \r\n\r\nNat\u00fcrlich h\u00e4ngen die obigen Werte von der Pendlerstrecke, der Duschdauer und der Liftart ab. Und auch was verglichen werden soll, ist oft sehr individuell. *What is Watt* ist deshalb auf allen Ebenen als offene Plattform konzipiert:\r\n\r\n1. **Offene Daten** dienen als Grundlage zur Berechnung der Szenarien.\r\n2. Die **Berechnungsmodelle** sind offen und dokumentiert. Man kann sie somit nachvollziehen, kritisieren und verbessern.\r\n3. Das Resultat jedes Szenarios ist ein Wert in Kilowattstunden. **Neue Szenarien** lassen sich so leicht hinzuf\u00fcgen und mit allen bestehenden vergleichen.\r\n4. *What is Watt* stellt die Szenarien \u00fcber eine **offene API** zur Verf\u00fcgung. Damit k\u00f6nnen **unterschiedliche Interfaces** und Visualisierungen die Daten auf ganz verschiedenste Art zug\u00e4nglich machen.\r\n\r\nDa alle vier Ebenen offen sind, ist es jedem m\u00f6glich zu *What is Watt* beizutragen. Typischerweise ist es ein neues Szenario, das jemanden pers\u00f6nlich interessiert. Wie viel Energie zum Beispiel eine Bitcoin-Transaktion verbraucht. Oder die eine Modelleisenbahn. Oder die E-Gitarre.\r\n\r\nDie Teilnehmer der [Energy Data Hackdays](https://hack.opendata.ch/event/24) k\u00f6nnen sich auf jeder der vier Ebenen bet\u00e4tigen und einen Beitrag zur Plattform liefern. \r\n\r\n\r\nUnd wer sich nun fragt, wie viel Energie eine Bitcoin-Transaktion verbraucht, hier die Antwort:\r\n\r\n\r\n\r\n
](https://twitter.com/algo_tecture)\n\n### References\nhttp://geopandas.org/reference.html\n","autotext_url":"https://github.com/2D/EnergieErneuerungsplanung","category_id":34,"category_name":"Dienste & Kunden","contact_url":"https://opendata-ch.slack.com/messages/CG8P68BJR","created_at":"2019-02-16T01:16","download_url":"","event_name":"Energy Data Hackdays 2019","event_url":"https://hack.opendata.ch/event/24","excerpt":"#### Challenge \r\n\r\n- [Erneuerungs-planung](https://hack.opendata.ch/project/301)\r\n\r\n**Objectives**\r\nWert von der Standhaltung und die Folgen von Infrastrukturhaltung. \r\nTopogie und Geometrie von der Betriebsnetz rekonstruieren.\r\n\r\n**Process**\r\nBased on existing Geodata a graph-based model was made. \r\nThe optimisation algorithm was applied to find an optimal path. \r\n\r\n#### Data\r\nChallenge_Unterhalt_Ausbau\r\nShape data format .shp\r\nExcel data over energy consumption per dwelling or commercial prope...","hashtag":"","id":341,"ident":null,"image_url":"https://github.com/2D/EnergieErneuerungsplanung/raw/master/energy-hackathon-341-0.png","is_challenge":false,"is_webembed":false,"logo_color":"#1ba51e","logo_icon":"battery-full","longtext":"#### Challenge \r\n\r\n- [Erneuerungs-planung](https://hack.opendata.ch/project/301)\r\n\r\n**Objectives**\r\nWert von der Standhaltung und die Folgen von Infrastrukturhaltung. \r\nTopogie und Geometrie von der Betriebsnetz rekonstruieren.\r\n\r\n**Process**\r\nBased on existing Geodata a graph-based model was made. \r\nThe optimisation algorithm was applied to find an optimal path. \r\n\r\n#### Data\r\nChallenge_Unterhalt_Ausbau\r\nShape data format .shp\r\nExcel data over energy consumption per dwelling or commercial property\r\n\r\n#### Tools\r\n\r\nThis team analysed the value and importance of infrastructure maintenance work, using following tools \u2192 QGIS, rhino, grasshopper, mapbox, jupyter notebook (used libraries are to be updated).\r\n\r\nThe Slack channel #energy-plan is used for communication. \r\n\r\n#### Results\r\n\r\nOptimisation Algorithm was applied over a graph for finding the required maintenance root. \r\n\r\nFormed a working version on the [GitHub](https://github.com/2D/EnergieErneuerungsplanung)\r\n\r\n### Team\r\n\r\nMembers are @wolfram and @dimi","maintainer":"oleg","name":"Algorithmische Erneuerungsplanung","phase":"Prototype","progress":30,"score":82,"source_url":"https://github.com/2D/EnergieErneuerungsplanung","stats":{"commits":0,"during":26,"people":2,"sizepitch":1023,"sizetotal":4271,"total":30,"updates":27},"summary":"Value consequences in maintenance infrastructure for power supply","team":"oleg, wolfram, dimi","team_count":2,"updated_at":"2019-02-19T11:27","url":"https://hack.opendata.ch/project/341","webpage_url":""},{"autotext":"","autotext_url":"","category_id":33,"category_name":"Netze","contact_url":"https://opendata-ch.slack.com/messages/CG8S4B14M","created_at":"2019-02-16T01:12","download_url":"","event_name":"Energy Data Hackdays 2019","event_url":"https://hack.opendata.ch/event/24","excerpt":"Geb\u00e4udepass is developing a \"building passport\" that documents and portrays all relevant energy-related information about a building. The goal is to develop a concept that helps the state, canton, municipalities and / or cities to evaluate their state and needs when it comes to buildings.\r\n\r\n---\r\n\r\n**Challenge:** [Geb\u00e4ude-pass](https://hack.opendata.ch/project/300)\r\n**Demo:** [abdagon.wwwnl1-ls3](http://abdagon.wwwnl1-ls3.a2hosted.com/bp/web/)\r\n\r\n# Challenge Ergebnisse\r\n\r\n**Die Ergebnisse sind i...","hashtag":"","id":339,"ident":null,"image_url":"","is_challenge":false,"is_webembed":true,"logo_color":"","logo_icon":"","longtext":"Geb\u00e4udepass is developing a \"building passport\" that documents and portrays all relevant energy-related information about a building. The goal is to develop a concept that helps the state, canton, municipalities and / or cities to evaluate their state and needs when it comes to buildings.\r\n\r\n---\r\n\r\n**Challenge:** [Geb\u00e4ude-pass](https://hack.opendata.ch/project/300)\r\n**Demo:** [abdagon.wwwnl1-ls3](http://abdagon.wwwnl1-ls3.a2hosted.com/bp/web/)\r\n\r\n# Challenge Ergebnisse\r\n\r\n**Die Ergebnisse sind in einer Pr\u00e4sentation und deren Anhang dokumentiert, inkl. Visualisierungen** (siehe oben)\r\n\r\n## Research\r\n\r\n* In Europa bestehen viele Studien und Projekte f\u00fcr Geb\u00e4udep\u00e4sse (Pr\u00e4sentation Anhang)\r\n* F\u00fcr Geb\u00e4udesanierungen existiert eine ausgereifte L\u00f6sung eValo\r\n* Viele Daten existieren, sind aber nicht zug\u00e4nglich\r\n\r\n## Potentiell verf\u00fcgbare Daten f\u00fcr Geb\u00e4udepass \"Cloud\"\r\n\r\n* GWR (Geb\u00e4ude- und Wohnungsregister)\r\n* EVU CRM, Leitung-Kataster, ...\r\n* Sonnendach\r\n* Erdw\u00e4rme\r\n* Feuerungs Datenbank\r\n* Pro Novo (SwissGrid Photovoltaik)\r\n* Evtl. dynamische Messdaten (Strom, Heizungsrechnung)\r\n\r\n## Datenhack Raumw\u00e4rme Aarau\r\n\r\nGWR enth\u00e4lt potentiell viele Daten, darf jedoch nicht in vollem Umfang genutzt werden - der Datenhack war auf Raumw\u00e4rme und Warmwasser Aarau beschr\u00e4nkt\r\n\r\n## Geb\u00e4udepass \u00abCloud\u00bb - Zielsetzung\r\n\r\n* Nutzung **existierender Daten** \u2013 Vermeidung von Mehrfach-Erfassungen\r\n* Plattform f\u00fcr **Energie- und Investitions-Optimierung** f\u00fcr Geb\u00e4udebesitzer, Gemeinden, Kantone, Bund, Energieversorger\r\n* Nutzung **erg\u00e4nzender Daten** f\u00fcr plausible, konkrete und fr\u00fchzeitige Optimierungs-Vorschl\u00e4ge (z.B. Verf\u00fcgbarkeit Gas, Fernw\u00e4rme, ...)\r\n* Prozesse (inkl. Validierung) und Anreize (z.B. Steuererleichterungen) f\u00fcr **hohe Datenqualit\u00e4t**\r\n\r\n## Geb\u00e4udepass \u00abCloud\u00bb - Nutzen\r\n\r\n### Geb\u00e4udebesitzer\r\n\r\n* Vorschl\u00e4ge f\u00fcr Sanierungsmassnahmen\r\n* Business Cases f\u00fcr Energie Optimierungen\r\n* \u201cPreventive Maintenance\u201d\r\n* \u201cLogbuch\u201d f\u00fcr Sanierungen\r\n* Dokumentation f\u00fcr Verkauf\r\n\r\n### Gemeinden, Kantone, Bund, Energieversorger\r\n\r\n* Verbesserung Datenqualit\u00e4t mit Bev\u00f6lkerung\r\n* Energieplanung\r\n* Umsetzung Strategie 2050\r\n* Validierung F\u00f6rderungsystem\r\n* Quantifizierung\r\n* Simulation, Szenarien\r\n\r\n## Geb\u00e4udepass \u00abCloud\u00bb - Prototyp\r\n\r\nAuf der CMS Drupal Plattform wurde mit einem Aufwand von ca. 1 Stunde ein einfacher Prototyp f\u00fcr einen webbasierten Prototyp entwickelt, um die m\u00f6gliche Funktionalit\u00e4t zu demonstrieren. Eine solche Anwendung hat ohne Daten jedoch nur einen geringen Nutzen.\r\n\r\nhttp://abdagon.wwwnl1-ls3.a2hosted.com/bp/web/\r\n\r\n## Geb\u00e4udepass \u00abCloud\u00bb - Erkenntnisse\r\n\r\n* Einzell\u00f6sungen vorhanden\r\n* Fehlende Integration \u2013 Mehrfacherfassungen n\u00f6tig \ud83e\udd2e\r\n* Teilweise ungen\u00fcgende Datenqualit\u00e4t \u2013 fehlerhafte bzw. veraltete Daten\r\n* Sehr viele Daten existierend \u2013 aber in Silos und nicht zug\u00e4nglich\r\n* **Nutzung m\u00f6glichst vieler bestehender Daten \u2013 mit kontrolliertem Zugang**\r\n* **Datenzugang mit Identifikation erm\u00f6glichen, Nutzung protokollieren**\r\n\r\n## Geb\u00e4udepass \u00abCloud\u00bb - Projekt\r\n\r\n* Fokus Gemeinde \u2013 **PoC Aarau**, mit Zukunftsregion Argovia\r\n* Daten von GWR, EVU \u2013 eValo Anbindung\r\n* Zugang mit Identifikation (SwissID)\r\n* \u00abAbfragen\u00bb f\u00fcr Nutzen Optionen\r\n\r\n**Erstes update**\r\n\r\nWir haben uns \u00fcberlegt wie eine Geb\u00e4udepass aussehen k\u00f6nnten, verschiedene Daten angeschaut. Es gibt in andere L\u00e4ndern bereits L\u00f6sungen f\u00fcr den Geb\u00e4udepass - wir fokussieren uns um die Frage, wie wir an die Daten herankommt. 2 Problemfelder: die Daten sind z.T. nicht \u00f6ffentlich zug\u00e4nglich, auch wenn durch Steuer bezahlt. Was man zusammenkriegt gen\u00fcgt nicht zum zusammenzuladen. Wir haben den Geb\u00e4udepass gedacht f\u00fcr Geb\u00e4udebesitzer. Eine sch\u00f6ne Grafik w\u00e4re interessant auch f\u00fcr Bund, Kantone, Gemeinde zum gemeinsame Bilder von Bedarf zu setzen. Wir sind am abkl\u00e4ren ein Projekt zu machen mit der Zukunftsregion Aargau. Wir haben uns gefragt wer und wo interessiert w\u00e4re mitzumachen. Stadt Aargau pr\u00fcft schon ob sie k\u00f6nnten eine Proof of Concept machen. Wir \u00fcberlegen uns wie das Projekt aussieht, und ganz schnell zu Prototypen kommen.","maintainer":"oleg","name":"Geb\u00e4udepass \"Cloud\"","phase":"Share","progress":50,"score":82,"source_url":"","stats":{"commits":0,"during":16,"people":2,"sizepitch":4043,"sizetotal":4076,"total":19,"updates":16},"summary":"Solutions for a Building Passport","team":"oleg, nikki_bhler, PeterJanes","team_count":2,"updated_at":"2019-02-19T07:56","url":"https://hack.opendata.ch/project/339","webpage_url":"https://docs.google.com/presentation/d/e/2PACX-1vTt4XECeh-KjnKd8qU1Zc53ggsUGwKyLIhPU4OgBK2ibel-dXV1ADx5oPtuXYKu75WA0EAklK7rPJaB/embed?start=false&loop=false&delayms=3000"},{"autotext":"","autotext_url":"","category_id":32,"category_name":"Produktion","contact_url":"https://opendata-ch.slack.com/messages/CG946F5DM","created_at":"2019-02-15T16:04","download_url":"","event_name":"Energy Data Hackdays 2019","event_url":"https://hack.opendata.ch/event/24","excerpt":"We created a web app that allows users to check the status of their solar installations by evaluating if the energy production is at a normal state. Our application aims at providing a quick verification of the monthly energy production of rooftop solar panels. The user will provide the following input:\r\n\r\n1. Location of the solar panel: address\r\n2. Size of PV: area in m2\r\n3. Capacity kWp\r\n4. 12 months of production data\r\n \r\nThe app looks up the estimations from [sonnendach](https://www.uvek-gi...","hashtag":"","id":302,"ident":null,"image_url":"","is_challenge":false,"is_webembed":false,"logo_color":"","logo_icon":"","longtext":"We created a web app that allows users to check the status of their solar installations by evaluating if the energy production is at a normal state. Our application aims at providing a quick verification of the monthly energy production of rooftop solar panels. The user will provide the following input:\r\n\r\n1. Location of the solar panel: address\r\n2. Size of PV: area in m2\r\n3. Capacity kWp\r\n4. 12 months of production data\r\n \r\nThe app looks up the estimations from [sonnendach](https://www.uvek-gis.admin.ch/BFE/sonnendach/?lang=de), compares the the input and returns: \r\n\r\n1. Location on map\r\n2. Status: ok or not ok\r\n3. Monthly comparison of actual vs. reference as a bar chart\r\n\r\nSee our [wiki](https://github.com/cype/PVDiagnose/wiki) for more information.\r\n\r\nHere the web app prototype (1) [user interface](http://energy-data-hackdays-d.s3-website.eu-central-1.amazonaws.com/) and (2) [output results - bar chart](http://energy-data-hackdays-d.s3-website.eu-central-1.amazonaws.com/results.html) and [diagnosis](http://energy-data-hackdays-d.s3-website.eu-central-1.amazonaws.com/results1.html)\r\n\r\nTeam members: Tetiana, Adrian, Andreas, Angelos, Bogdan, Braulio, Daniel, David, Martin (@Mhertach) and Tobias","maintainer":"nikki_bhler","name":"PV Diagnose","phase":"Prototype","progress":30,"score":76,"source_url":"https://github.com/cype/PVDiagnose","stats":{"commits":0,"during":29,"people":4,"sizepitch":1217,"sizetotal":1311,"total":30,"updates":25},"summary":"An application for small scale PV owners to check whether their installation is still healthy.","team":"nikki_bhler, brauliobarahona, Andreas, tanapolg","team_count":4,"updated_at":"2019-02-16T13:44","url":"https://hack.opendata.ch/project/302","webpage_url":"http://energy-data-hackdays-d.s3-website.eu-central-1.amazonaws.com/"},{"autotext":"","autotext_url":"","category_id":35,"category_name":"Mobilit\u00e4t","contact_url":"https://opendata-ch.slack.com/messages/CG8AA61NX","created_at":"2019-02-16T01:20","download_url":"","event_name":"Energy Data Hackdays 2019","event_url":"https://hack.opendata.ch/event/24","excerpt":"**Projektziel**\r\n\r\nPlanungshilfe f\u00fcr neue Standorte von E-Mobil-Ladestationen, die \u00f6ffentlich zug\u00e4nglich sind. \r\n\r\n**Analyse der Ausgangslage und Formulierung der Fragestellung**\r\n\r\nDie unterschiedlichen Stakeholder (Verteilnetzbetreiber, Gemeinde, Nutzer eine Elektromobils) wurden analysiert und deren Anforderungen an Standorte f\u00fcr Ladestationen formuliert. Anschliessend wurden die Nutzungsformen (Private Nutzung f\u00fcr Einkaufen, Besuche / Arbeitsnutzung zum Pendeln oder Kundenbesuche / Freizeitn...","hashtag":"","id":342,"ident":null,"image_url":"https://upload.wikimedia.org/wikipedia/commons/thumb/e/e7/Font_Awesome_5_solid_charging-station.svg/128px-Font_Awesome_5_solid_charging-station.svg.png","is_challenge":false,"is_webembed":true,"logo_color":"#bee59e","logo_icon":"","longtext":"**Projektziel**\r\n\r\nPlanungshilfe f\u00fcr neue Standorte von E-Mobil-Ladestationen, die \u00f6ffentlich zug\u00e4nglich sind. \r\n\r\n**Analyse der Ausgangslage und Formulierung der Fragestellung**\r\n\r\nDie unterschiedlichen Stakeholder (Verteilnetzbetreiber, Gemeinde, Nutzer eine Elektromobils) wurden analysiert und deren Anforderungen an Standorte f\u00fcr Ladestationen formuliert. Anschliessend wurden die Nutzungsformen (Private Nutzung f\u00fcr Einkaufen, Besuche / Arbeitsnutzung zum Pendeln oder Kundenbesuche / Freizeitnutzung f\u00fcr Ausfl\u00fcge oder Reisen) der unterschiedlichen Nutzer (Familien, Einzelpersonen, Paare, \u00e4ltere Personen...) unterschiedlicher Wohnformen (Einfamilienhaus, Mehrfamilienhaus, Eigentum oder Miete, st\u00e4dtisch oder l\u00e4ndlich) mit unterschiedlichen Mobilit\u00e4tsformen (Privatauto, Miet- oder Sharing-Auto, Velo, Zug oder Tram/Bus) analysiert. Dazu k\u00f6nnte eine detaillierte Informationendatenbank aufbereitet werden. \r\n\r\n**Prototyp**\r\n\r\nNach der Betrachtung vorhandener Daten und m\u00f6glicher Umsetzungen aus Sicht der unterschiedlichen Stakeholder wurde f\u00fcr dieses Projekt beschlossen, dass ein Prototyp einer GIS-basierten Planungshilfe f\u00fcr Gemeinden erstellt wird. Mit der bestehenden Datengrundlage f\u00fcr den Kanton Aargau wie \u00f6ffentlich zug\u00e4ngliche Ladestationen, Park&Ride Standorte, Park&Pool Standorte und Parkpl\u00e4tze des Tiefbauamts kann die Karte analysiert und Indizien f\u00fcr zus\u00e4tzliche Ladestandorte eruiert werden. \r\n\r\n**Weitere Bearbeitung des Prototyps**\r\n\r\nWas zus\u00e4tzlich eingebunden werden k\u00f6nnte: visualisierte Pendlerstr\u00f6me, Hauptverkehrsachsen (als Heatmap), SBB-Bahnh\u00f6fe, Standort von Trafostationen, Standort von PV-Anlagen, Standort von Batterien, bestehende (konventionelle) Tankstellen, Auslastung (Anzahl und Dauer der Parkplatznutzung, Anzahl und Dauer der Ladevorg\u00e4nge) der Lades\u00e4ulen...\r\n\r\n**Teamwork**\r\n\r\nUnserer Team ist Freitag leider von 6 auf 3 geschrumpft. Ein Grossteil der Zeit wurde verwendet, die Fragestellung zu diskutieren, den UseCase einzugrenzen und vorhandene Daten zu finden. Am Samstag haben wir den Prototypen umgesetzt und das Projekt dokumentiert. \r\n\r\n---\r\n\r\n#### Challenge \r\n\r\n- [Standort planung](https://hack.opendata.ch/project/281)\r\n\r\n#### Data\r\n\r\n- https://lemnet.org/\r\n- https://data.geo.admin.ch/ch.bfe.ladestellen-elektromobilitaet/data/ch.bfe.ladestellen-elektromobilitaet.json\r\n- https://www.bfs.admin.ch/bfs/de/home/statistiken/mobilitaet-verkehr/personenverkehr.html\r\n- Netzbetreiber Aargau\r\n- Park & Ride Aargau\r\n- Park & Pool Aargau\r\n- Parkpl\u00e4tze Tiefbauamt Kanton Aargau\r\n\r\n---\r\n\r\n\ud83d\udea7 **Under Construction** \ud83d\udea7\r\n\r\n","maintainer":"oleg","name":"Ladestationen-Standortplanung","phase":"Prototype","progress":30,"score":74,"source_url":"https://github.com/felixgantner/felixgantner.github.io","stats":{"commits":0,"during":23,"people":1,"sizepitch":2566,"sizetotal":2598,"total":24,"updates":22},"summary":"A view on the future of planning","team":"oleg, mefe","team_count":1,"updated_at":"2020-08-17T08:55","url":"https://hack.opendata.ch/project/342","webpage_url":"https://felixgantner.github.io/ladestationen_aargau.html"},{"autotext":"# PV-Potential on SBB-Areas\nThe goal of the project is to assess the PV-potential of areas owned by SBB. We use a dataset from SBB containing: Jahresverbrauch, Anschl\u00fcsse, and Geb\u00e4ude-shapes, for each address.\nOn this dataset we did a general potential analysis over all addresses.\nFor a more detailed assessment and visualization of potential \"Zussammenschl\u00fcsse\" of adjoining parcels we linked the SBB data with the swiss energy planning app of geoimpact which collects, links, and visualizes several open datasets (e.g., from Sonnendach, Elcom, ...)\n\n\n# General Potential Analysis\nPV-potential over all SBB-areas:\n\n**** 153 GWh (LCOE<10 Rp/kWh) --> 0.3% of total swiss electricity consumtion ****\n\n**** 270 GWh (LCOE<15 Rp/kWh) --> 0.5% of total swiss electricity consumtion ****\n\nCO2 reduction potential over all SBB-areas:\n\n**** ~7000 tons of CO2 reduction (LCOE<10 Rp/kWh) ****\n\n**** ~12000 tons of CO2 reduction (LCOE<15 Rp/kWh) ****\n\nFigure: Total electricity generation potential from PV: 130 GWh (LCOE<10 Rp/kWh), 270 GWh (LCOE<15 Rp/kWh). Ranking of Gemeinde by total potential area for PV installation (roof area that intersects and within the parcel):\n\n\nFigure: Potential vs. PV LCOE for each parcel. With Gemeinde names where the parcel is located in. Parcels on on top left corner (high potential, low LCOE) shall be looked into:\n\n\nData and code:\nhttps://github.com/magnetilo/max-pv-strom-sbb/blob/master/SBB%20ZEV%20-%20levelized%20cost%20of%20electricity.ipynb\n\n# Assessment and Visualization of parcels and potential \"Zusammenschl\u00fcsse zum Eigenverbrauch (ZEV)\"\nWhen you want to find ZEV you need to consider the geographic locations of the SBB-parcels, most importantly if two parcels are linked to each other through parcels that belong all to the same owner. In the case of SBB the ownership of train-track-parcels is especially interesting as they link different parcels over a large range (virtually over the whole country), which allows potentially for huge ZEV (see figure \"SBB Areale & M\u00f6glichkeiten ZEV\"). However, it is not clear yet if the connection across train tracks is physically feasible and makes economically sense.\n\n\n\nWe approach the assessment of the potential for ZEV with a qualitative model considering the aspects: \"Energie\", \"Wirtschaftlichkeit\", and \"Realisierbarkeit\". We divided our team into three subgroups working on the topics data, model, and visualization (see figure \"Teamaufteilung\").\n\n\n\nThe main task of the data team was the embedding of the SBB data into the swiss energy planning app, where several nasty problems arose.\n\nThe model team developed a qualitative model based on quantitative data for assessing the potential of each SBB parcel (or potentially any cluster of parcels, see figure \"Modell\").\n\n\n\nFinally, we visualized the potential assessment and all the information of interest for each parcel on a interactive map in the swiss energy planning app (see figure \"Swiss Energy Planning\").\n\n\n","autotext_url":"https://github.com/magnetilo/max-pv-strom-sbb","category_id":32,"category_name":"Produktion","contact_url":"https://opendata-ch.slack.com/messages/CG85VQGTW","created_at":"2019-02-16T01:01","download_url":"","event_name":"Energy Data Hackdays 2019","event_url":"https://hack.opendata.ch/event/24","excerpt":"SBB ZEV aims to analyse the potential of different SBB buildings to become self-powering entities. In a second step, this evaluation will be visualised to make it more accessible.\r\n\r\n**Data & code:** Notebook\r\n\r\n**Challenge:** [Max PV-Strom SBB-Arealen](https://hack.opendata.ch/project/296)\r\n","hashtag":"","id":335,"ident":null,"image_url":"https://avatars3.githubusercontent.com/u/10993772?v=4","is_challenge":false,"is_webembed":true,"logo_color":"","logo_icon":"","longtext":"SBB ZEV aims to analyse the potential of different SBB buildings to become self-powering entities. In a second step, this evaluation will be visualised to make it more accessible.\r\n\r\n**Data & code:** Notebook\r\n\r\n**Challenge:** [Max PV-Strom SBB-Arealen](https://hack.opendata.ch/project/296)\r\n","maintainer":"oleg","name":"SBB ZEV","phase":"Sketching","progress":20,"score":70,"source_url":"https://github.com/magnetilo/max-pv-strom-sbb","stats":{"commits":0,"during":6,"people":2,"sizepitch":452,"sizetotal":4091,"total":14,"updates":11},"summary":"Visualize the potential of different SBB buildings as self-powering communities","team":"oleg, magnetilo, xiaojin.zhang","team_count":2,"updated_at":"2019-04-04T11:35","url":"https://hack.opendata.ch/project/335","webpage_url":"https://rawcdn.githack.com/magnetilo/max-pv-strom-sbb/ac80664d500fa12d6346137f4f980d31c76652a9/sep.png"},{"autotext":"","autotext_url":"","category_id":35,"category_name":"Mobilit\u00e4t","contact_url":"https://opendata-ch.slack.com/messages/CG7L6MC01","created_at":"2019-02-16T01:26","download_url":"","event_name":"Energy Data Hackdays 2019","event_url":"https://hack.opendata.ch/event/24","excerpt":"This team is analysing fresh SBB weather data.\r\n\r\n#### Challenge \r\n\r\n- [Welchen Einfluss hat das Wetter auf deine Zugfahrt? ](https://hack.opendata.ch/project/297)\r\n\r\n#### Data\r\n\r\nStatt teuer Wetter Daten einzukaufen, k\u00f6nnten die Daten vom Integrated Surface Database (ISD) des amerikanischen Wetterdienst bezogen werden. Enthalten sind hier die historischen Stundenwerte aller Wetterstationen weltweit. Die Daten sind frei verf\u00fcgbar. \r\n\r\n#### First Update\r\n\r\n_We are working with SBB weather data, d...","hashtag":"","id":345,"ident":null,"image_url":"","is_challenge":false,"is_webembed":true,"logo_color":"","logo_icon":"","longtext":"This team is analysing fresh SBB weather data.\r\n\r\n#### Challenge \r\n\r\n- [Welchen Einfluss hat das Wetter auf deine Zugfahrt? ](https://hack.opendata.ch/project/297)\r\n\r\n#### Data\r\n\r\nStatt teuer Wetter Daten einzukaufen, k\u00f6nnten die Daten vom Integrated Surface Database (ISD) des amerikanischen Wetterdienst bezogen werden. Enthalten sind hier die historischen Stundenwerte aller Wetterstationen weltweit. Die Daten sind frei verf\u00fcgbar. \r\n\r\n#### First Update\r\n\r\n_We are working with SBB weather data, did some wrangling and found some outliners which they were very thankful for - e.g. some trains which ran 1 km per second. The data is 2GB of 5 minute periods for one year, it's in a separate file to the track data. Still struggling with that, but we have some models we are planning, and ran some already on the data. We'll see what we can build by tomorrow._\r\n\r\n#### Energielast Tool\r\n\r\nF\u00fcr einen produktiven Einsatz bei den SBB k\u00f6nnten die Real-Time Daten von MeteoSchweiz (Open Data) eingebunden werden. Es k\u00f6nnte dann der Energieverbrauch berechnet werden. Ein sehr einfachen Prototype findet sich unter http://hackday.nemundo.ch","maintainer":"oleg","name":"sbbweather","phase":"Prototype","progress":30,"score":62,"source_url":"","stats":{"commits":0,"during":7,"people":2,"sizepitch":1134,"sizetotal":1193,"total":9,"updates":6},"summary":"What influence does the weather have on your train journey?","team":"oleg, urs_lang","team_count":2,"updated_at":"2019-02-19T11:31","url":"https://hack.opendata.ch/project/345","webpage_url":"https://hackday.nemundo.ch/"},{"autotext":"","autotext_url":"","category_id":34,"category_name":"Dienste & Kunden","contact_url":"https://opendata-ch.slack.com/messages/CG85BSGBU","created_at":"2019-02-16T01:23","download_url":"","event_name":"Energy Data Hackdays 2019","event_url":"https://hack.opendata.ch/event/24","excerpt":"Freestyle is an app that helps people use energy in time periods that are less burdened.\r\n\r\n\r\n\r\n> _Wir sind nur zu 3. Wir m\u00f6chten einen App machen zum Zeitperiode lenken die auf der Kurve nicht so belastet sind. Wir haben verschiedene Ger\u00e4te die nicht der ganzen Tag laufen m\u00fcssen. Unseren Tool soll erlauben EV einzugeben und plannen, und die Kurve abzugleichen. Gamification kommt darein. Wir sind daran die Infrastruktur aufz...","hashtag":"","id":343,"ident":null,"image_url":"https://avatars0.githubusercontent.com/u/2895704?s=460&v=4","is_challenge":false,"is_webembed":false,"logo_color":"","logo_icon":"","longtext":"Freestyle is an app that helps people use energy in time periods that are less burdened.\r\n\r\n\r\n\r\n> _Wir sind nur zu 3. Wir m\u00f6chten einen App machen zum Zeitperiode lenken die auf der Kurve nicht so belastet sind. Wir haben verschiedene Ger\u00e4te die nicht der ganzen Tag laufen m\u00fcssen. Unseren Tool soll erlauben EV einzugeben und plannen, und die Kurve abzugleichen. Gamification kommt darein. Wir sind daran die Infrastruktur aufzubauen, den App zu schreiben, schauen was passiert._\r\n\r\n---\r\n\r\n#### Challenge \r\n\r\n- [Gamification Verhalten](https://hack.opendata.ch/project/283)\r\n\r\n#### Code\r\n\r\n- https://github.com/lichtwellenreiter/eh_app\r\n- https://github.com/lichtwellenreiter/eh_evu\r\n- https://github.com/lichtwellenreiter/eh_haushalt\r\n\r\n ","maintainer":"oleg","name":"Freestyle","phase":"Prototype","progress":30,"score":61,"source_url":"https://github.com/lichtwellenreiter","stats":{"commits":0,"during":3,"people":0,"sizepitch":885,"sizetotal":914,"total":6,"updates":5},"summary":"Gamify your Electricity Usage","team":"oleg","team_count":0,"updated_at":"2019-02-25T22:29","url":"https://hack.opendata.ch/project/343","webpage_url":""},{"autotext":"","autotext_url":"","category_id":35,"category_name":"Mobilit\u00e4t","contact_url":"https://opendata-ch.slack.com/messages/CFPUZ7GKV","created_at":"2019-02-16T11:27","download_url":"","event_name":"Energy Data Hackdays 2019","event_url":"https://hack.opendata.ch/event/24","excerpt":"This project devises a fun way to investigate the equipment that people bring to a hackathon, and provoke conversation about energy usage and standards. \r\n\r\n# How to\r\n\r\n### 1. Bring a kitchen scale to the hackathon, or find one on location \r\n\r\n\r\n\r\n_(Thanks, Bernhard!)_\r\n\r\n_((The Micro:bit is just for decoration - bonus points for using a smart scale!))_\r\n\r\n### 2. Collect the data in some way. You can use our proto-app,...","hashtag":"","id":346,"ident":null,"image_url":"","is_challenge":false,"is_webembed":false,"logo_color":"","logo_icon":"","longtext":"This project devises a fun way to investigate the equipment that people bring to a hackathon, and provoke conversation about energy usage and standards. \r\n\r\n# How to\r\n\r\n### 1. Bring a kitchen scale to the hackathon, or find one on location \r\n\r\n\r\n\r\n_(Thanks, Bernhard!)_\r\n\r\n_((The Micro:bit is just for decoration - bonus points for using a smart scale!))_\r\n\r\n### 2. Collect the data in some way. You can use our proto-app, for instance.\r\n\r\n`-->` **[JamBricks App](https://blog.datalets.ch/workshops/2019/energy/jb/)** `<--`\r\n\r\n_NB:_ the data is not yet saved anywhere except on your own computer!\r\n\r\n### 3. Measure the **Weight** (in grams) of every participant's power supply and read the **Wattage** from the label.\r\n\r\nPro tip: if the Wattage is not stated, multiply the number of Volts by the Amps, e.g.:\r\n\r\n`19.5V x 3.34A ~= 65W`\r\n\r\n### 4. Copy and paste the resulting totals on your project page, and ask the other teams to do the same! \r\n\r\nFor example, you would get something like this:\r\n\r\n\r\n\r\n# Show me the data\r\n\r\nYou can find a table of all of our [results from #energyhack19 here](https://gist.github.com/loleg/a7de098d5c5beed2f1e88dc98bc4af3b) (GitHub)\r\n\r\nWe dragged a total of **12.0 kg** of power supplies rated a total of **3'890 W** across all 59 people surveyed. Some people did not have a PSU and seemed to last the hackathon on a battery charge - _what's your secret?_\r\n\r\nCongratulations to Andreas for bringing the \"heavy\" to the Hackdays, a 435 g brick, which also is the highest rated we found at 148 W.\r\n\r\n### Wait, but why?\r\n\r\nLaptops and other mobile computing devices are a prerequisite of hackathons. You could support your team's design efforts with a pad of paper and pencil, and you should - but most people would feel left out if they came to a coding party without their devices. \r\n\r\nPeople bring all kinds of hardware to hackathons. Back in the days of the [LAN party](https://blog.datalets.ch/050/) we used to bring whole PCs and bulky monitors on site. These days we might do well to do our coding for the weekend on an tablet. In sports, people pay attention to the \"hardware\": the shape and size [of bicycles](https://www.cyclingweekly.com/news/latest-news/fabian-cancellaras-custom-2015-trek-domane-155811) or [skis](https://www.pugski.com/threads/rank-the-race-skis-in-order.2615/), for instance. \r\n\r\nWe have never thought about the power consumption figures of our computers before - but today the issues of the excessive energy consumption of IT projects is a topic of [public concern](https://www.wired.com/story/bitcoin-global-warming/) (WIRED). Some people complain about their heavy power supplies, and we started wondering why Smart Homes and Offices don't have DC plugs, and got into a bit of the history of (the lack of) electricity standards. \r\n\r\nWith this project we aim to provoke some conversation about an overlooked element that may contribute to successful collaboration. \r\n\r\n### Inspirational quote\r\n\r\n> _It would be quite possible to devise a universal DC outlet that depended on an ID signal from the device being supplied, either from its cable or the from the device. This only needs to be a unique ID. As we only need a small range of voltages, typically from 3V to 24V we wouldn\u2019t need a complex code. An intelligent adaptor in the outlet would then set the voltage needed by that device. In a way this is done already with the plug and socket combination identifying the voltage. This also shows up the weakness of a smart outlet. You only need a lightweight connector for a device drawing small currents (e.g. Micro-C USB), but something more substantial would be needed for devices like printers and monitors that might draw peak currents of two or three amps. Perhaps two different sockets, one for low, and one for high power would be acceptable._\r\n\r\n-- Rob Gillatt, Electronics Engineer via [Quora](https://www.quora.com/Why-arent-DC-power-outlets-built-into-the-wall-so-electronic-devices-wouldnt-require-an-AC-DC-converter)\r\n\r\n## Credits\r\n\r\nThe web application is made with [Vue.js](http://vuejs.org) based on the [TodoMVC](https://vuejs.org/v2/examples/todomvc.html) boilerplate. You can fork the source code at [JSFiddle](https://jsfiddle.net/loleg/npdxs52f/62/).\r\n\r\nInspired by crowdsourcing data from participants, by physical hackathon projects like [Aufschnitthilfe](https://hack.opendata.ch/project/26), and by midnight reading about the reasons we cannot plug our devices directly into wall sockets. \r\n\r\n\ud83e\uddf1 3 bricks | 155 W | 261 g","maintainer":"loleg","name":"Jambricks","phase":"Research","progress":10,"score":50,"source_url":"https://jsfiddle.net/loleg/npdxs52f/62/","stats":{"commits":0,"during":4,"people":1,"sizepitch":4810,"sizetotal":4845,"total":10,"updates":8},"summary":"Plug n' play on your hackathon way!","team":"loleg","team_count":1,"updated_at":"2019-02-19T11:55","url":"https://hack.opendata.ch/project/346","webpage_url":"https://blog.datalets.ch/workshops/2019/energy/jb/"},{"autotext":"","autotext_url":"","category_id":34,"category_name":"Dienste & Kunden","contact_url":"","created_at":"2018-12-21T16:03","download_url":"","event_name":"Energy Data Hackdays 2019","event_url":"https://hack.opendata.ch/event/24","excerpt":"Unterschiedliches Verbrauchsverhalten bei unterschiedlichen Kunden erfordert unterschiedliche Arten der Kommunikation und des Marketings.\r\n\r\nDie vollst\u00e4ndige Liberalisierung des Strommarktes wird mittelfristig f\u00fcr 700 Schweizer Versorgungsunternehmen zur Realit\u00e4t. Kundenbindung steht im Mittelpunkt.\r\n\r\nAnders als bei Retailern wie Migros und coop ist Big Data Analyse der Kundendaten im Energiebereich bisher ein sehr sensibles Thema.\r\n\r\nZiel w\u00e4re ein Tool, welches in einem gew\u00fcnschten Netzgebiet ...","hashtag":"","id":286,"ident":null,"image_url":"https://opendata.utou.ch/goodrollin/Q.php?F","is_challenge":true,"is_webembed":null,"logo_color":"","logo_icon":"","longtext":"Unterschiedliches Verbrauchsverhalten bei unterschiedlichen Kunden erfordert unterschiedliche Arten der Kommunikation und des Marketings.\r\n\r\nDie vollst\u00e4ndige Liberalisierung des Strommarktes wird mittelfristig f\u00fcr 700 Schweizer Versorgungsunternehmen zur Realit\u00e4t. Kundenbindung steht im Mittelpunkt.\r\n\r\nAnders als bei Retailern wie Migros und coop ist Big Data Analyse der Kundendaten im Energiebereich bisher ein sehr sensibles Thema.\r\n\r\nZiel w\u00e4re ein Tool, welches in einem gew\u00fcnschten Netzgebiet alle potenziellen Kunden nach ihren Energiedienstleistungsbed\u00fcrfnissen gruppiert. Der ethisch korrekte Umgang mit Kundendaten stellt eine Vielzahl von Herausforderungen dar und k\u00f6nnte in der Entwicklung dieses Tools auch Gegenstand der Untersuchung sein.\r\n\r\nWelche Kundengruppen gibt es? Welche Bed\u00fcrfnisse haben diese Kundengruppen tats\u00e4chlich? Wie sehen massgeschneiderte Angebote f\u00fcr die verschiedenen Kundengruppen aus? Wie kann ich unter Ber\u00fccksichtigung ethischer orientierungspunkte f\u00fcr Big Data Analysen die Effizienz der Werbemassnahmen verbessern?","maintainer":"oleg","name":"Kunden + Data","phase":"Challenge","progress":-1,"score":2,"source_url":"","stats":{"commits":0,"during":0,"people":2,"sizepitch":1057,"sizetotal":1107,"total":4,"updates":1},"summary":"Kundensegmentierung und die jeweiligen Bed\u00fcrfnisse","team":"oleg, derrickoswald, emilieboillat","team_count":2,"updated_at":"2019-02-12T12:57","url":"https://hack.opendata.ch/project/286","webpage_url":""},{"autotext":"","autotext_url":"","category_id":33,"category_name":"Netze","contact_url":"","created_at":"2018-12-18T13:15","download_url":"","event_name":"Energy Data Hackdays 2019","event_url":"https://hack.opendata.ch/event/24","excerpt":"#### \u00abSpielerische\u00bb Herausforderungen von Versorgungsunternehmen und ein optimierter Lastgang\r\n\r\nDie Energiewende spielt sich im Verteilnetz (beim Endkunden) ab. Dezentralisierung ist eine der drei Hauptherausforderungen (Digitalisierung, Dekarbonisierung, Dezentralisierung) der Energiebranche.\r\n\u00a0\r\nDie zuk\u00fcnftigen Anforderungen f\u00fchren zu Engp\u00e4ssen im Verteilnetz, so dass ein aktives Engpassmanagement eine dauerhafte Aufgabe eines Verteilnetzbetreibers sein wird. Der Einbezug von Flexibilit\u00e4ten v...","hashtag":"","id":282,"ident":null,"image_url":"https://opendata.utou.ch/goodrollin/Q.php?B","is_challenge":true,"is_webembed":false,"logo_color":"","logo_icon":"","longtext":"#### \u00abSpielerische\u00bb Herausforderungen von Versorgungsunternehmen und ein optimierter Lastgang\r\n\r\nDie Energiewende spielt sich im Verteilnetz (beim Endkunden) ab. Dezentralisierung ist eine der drei Hauptherausforderungen (Digitalisierung, Dekarbonisierung, Dezentralisierung) der Energiebranche.\r\n\u00a0\r\nDie zuk\u00fcnftigen Anforderungen f\u00fchren zu Engp\u00e4ssen im Verteilnetz, so dass ein aktives Engpassmanagement eine dauerhafte Aufgabe eines Verteilnetzbetreibers sein wird. Der Einbezug von Flexibilit\u00e4ten von Lasten und Speichern mit hohem Automatisierungsgrad sind notwendig.\r\n\u00a0\r\nWas braucht es, um eine ideale Lastgangkurve f\u00fcr ein EVU oder ein Netzgebiet zu modellieren, die \u00aballes\u00bb ber\u00fccksichtigt?\r\n\u00a0\r\nModellierung von Verbrauchern (Smart Homes) mit ihren Ger\u00e4ten und \u00abvirtuelle\u00bb Steuerung dieser Beispielhafte Ger\u00e4te: Elektromobile, Batterien im Keller und ihre durch Endkunden getriebenen Betriebsmodi, Licht, Fernseher, Heizung/W\u00e4rmepumpe, Warmwasserboiler, PV Anlagen, etc.\r\nWas m\u00fcssen die Ger\u00e4te k\u00f6nnen? Annahme ist, das IoT in gewissen Rahmen vorhanden ist.\r\n\u00a0\r\nAlternativ k\u00f6nnte anhand des Gamification-Ansatzes auch der Eigenverbrauch eines Einfamilienhauses spielerisch optimiert werden (z.B. Auswirkung Installation PV + Elektrofahrzeug, das auch als Batterie dient, auf die eigene Lastganzkurve aufzeigen).","maintainer":"oleg","name":"Gamification Lastgang","phase":"Challenge","progress":-1,"score":2,"source_url":"","stats":{"commits":0,"during":1,"people":1,"sizepitch":1315,"sizetotal":1351,"total":6,"updates":4},"summary":"Optimierte Lastgangkurve f\u00fcr ein EVU","team":"oleg, pascaaal","team_count":1,"updated_at":"2019-02-14T22:10","url":"https://hack.opendata.ch/project/282","webpage_url":""},{"autotext":"","autotext_url":"","category_id":33,"category_name":"Netze","contact_url":"","created_at":"2019-01-28T08:31","download_url":"","event_name":"Energy Data Hackdays 2019","event_url":"https://hack.opendata.ch/event/24","excerpt":"Im Zusammengang mit einem risiko-orientierten Ansatz f\u00fcr die Erneuerungsplanung werden Betriebsmittel im Bereich Niederspannung (Verteilkabinen, Leitungen) auf Grundlage von Wichtigkeits- und Zustandskriterien eingesch\u00e4tzt. Insbesondere die Wichtigkeit stellt die Versorger auf Grund von teilweise fehlenden betrieblichen Daten aber vor Herausforderungen. K\u00f6nnen anhand von vorliegenden Vergangenheitsdaten aus IT-Systemen (bspw. SAP, GIS) geeignete Kriterien zur Beurteilung der Wichtigkeit der Betr...","hashtag":"","id":301,"ident":null,"image_url":"https://opendata.utou.ch/goodrollin/Q.php?H","is_challenge":true,"is_webembed":false,"logo_color":"","logo_icon":"","longtext":"Im Zusammengang mit einem risiko-orientierten Ansatz f\u00fcr die Erneuerungsplanung werden Betriebsmittel im Bereich Niederspannung (Verteilkabinen, Leitungen) auf Grundlage von Wichtigkeits- und Zustandskriterien eingesch\u00e4tzt. Insbesondere die Wichtigkeit stellt die Versorger auf Grund von teilweise fehlenden betrieblichen Daten aber vor Herausforderungen. K\u00f6nnen anhand von vorliegenden Vergangenheitsdaten aus IT-Systemen (bspw. SAP, GIS) geeignete Kriterien zur Beurteilung der Wichtigkeit der Betriebsmittelgruppen (Verteilkabinen, Leitungen) definiert werden?\r\n\r\nWie k\u00f6nnte ein Datenmodell aussehen, mit dem ein systematischer Ansatz - bspw. welche Daten werden ben\u00f6tigt, wie werden die Daten miteinander kombiniert, welche Daten k\u00f6nnten eventuell in Zukunft einen m\u00f6glichen Beitrag leisten, etc. - f\u00fcr die Ermittlung einer Zustandsbeurteilung aussehen? Der Ansatz soll k\u00fcnftig unabh\u00e4ngig vom versorgten Gebiet und unabh\u00e4ngig von der Netztopologie (Stichwort vermaschtes oder sternf\u00f6rmiges Netz) angewendet werden k\u00f6nnen.","maintainer":"oleg","name":"Erneuerungs-planung","phase":"Challenge","progress":-1,"score":0,"source_url":"","stats":{"commits":0,"during":0,"people":1,"sizepitch":1025,"sizetotal":1064,"total":4,"updates":2},"summary":"Zustandsbeurteilung von Betriebsmitteln","team":"oleg","team_count":1,"updated_at":"2019-02-14T22:11","url":"https://hack.opendata.ch/project/301","webpage_url":""},{"autotext":"","autotext_url":"","category_id":34,"category_name":"Dienste & Kunden","contact_url":"","created_at":"2018-12-21T17:06","download_url":"","event_name":"Energy Data Hackdays 2019","event_url":"https://hack.opendata.ch/event/24","excerpt":"Sch\u00e4den an Infrastrukturen von Versorgungsunternehmen entstehen immer und \u00fcberall. Gr\u00f6ssere Sch\u00e4den k\u00f6nnen umgehend lokalisiert und entsprechend behoben werden. Kleinere Sch\u00e4den werden h\u00e4ufig nicht rechtzeitig erkannt und bergen so die Gefahr, dass aus ihnen grosse Sch\u00e4den werden.\r\n\r\nWie kann die Schnittstelle zwischen dem Einwohner und dem Versorgungsunternehmen f\u00fcr beide Seiten Mehrwertstiftend gestaltet werden? Worauf muss ich als EVU achten? Wie bekomme ich als EVU den B\u00fcrger dazu, dass sich...","hashtag":"","id":291,"ident":null,"image_url":"https://opendata.utou.ch/goodrollin/Q.php?L","is_challenge":true,"is_webembed":null,"logo_color":"","logo_icon":"","longtext":"Sch\u00e4den an Infrastrukturen von Versorgungsunternehmen entstehen immer und \u00fcberall. Gr\u00f6ssere Sch\u00e4den k\u00f6nnen umgehend lokalisiert und entsprechend behoben werden. Kleinere Sch\u00e4den werden h\u00e4ufig nicht rechtzeitig erkannt und bergen so die Gefahr, dass aus ihnen grosse Sch\u00e4den werden.\r\n\r\nWie kann die Schnittstelle zwischen dem Einwohner und dem Versorgungsunternehmen f\u00fcr beide Seiten Mehrwertstiftend gestaltet werden? Worauf muss ich als EVU achten? Wie bekomme ich als EVU den B\u00fcrger dazu, dass sich dieser aktiv beteiligt? Was ist dem Kunden wichtig? Wie kann ich diese Schnittstelle gestalten, damit ich ggf. auch Zugang zum Kunden bekomme? Welche M\u00f6glichkeiten f\u00fcr einen Anreiz gibt es? Wie kann/sollte ein erkannter Defekt kommuniziert werden?\r\n\r\n**Unterst\u00fctzt Gamification die Partizipation und Kommunikation?**\r\n\r\nWie kann mittels Gamification ein zus\u00e4tzlicher Anreiz zur Partizipation und Kommunikation zwischen Endkunden und Versorgungsunternehmen geschaffen werden?","maintainer":"oleg","name":"B\u00fcrger-partizipation","phase":"Challenge","progress":-1,"score":0,"source_url":"","stats":{"commits":0,"during":0,"people":0,"sizepitch":975,"sizetotal":1001,"total":2,"updates":1},"summary":"Kommunikation Endkunde-EVU","team":"oleg","team_count":0,"updated_at":"2019-02-12T13:04","url":"https://hack.opendata.ch/project/291","webpage_url":""},{"autotext":"","autotext_url":"","category_id":35,"category_name":"Mobilit\u00e4t","contact_url":"","created_at":"2018-12-21T17:15","download_url":"","event_name":"Energy Data Hackdays 2019","event_url":"https://hack.opendata.ch/event/24","excerpt":"Der Energieverbrauch einer Zugfahrt h\u00e4ngt von vielen verschiedenen Einflussgr\u00f6ssen ab und kann stark variieren. Die Gesamtmasse, Streckenl\u00e4nge, Topologie (insbesondere Steigungen, Tunnel), der Geschwindigkeitsverlauf, Fahrzeugtechnik und nicht zuletzt die meteorologischen Umgebungsbedingungen sind die dominierenden Gr\u00f6ssen. Beim Wetter hat z.B. der Wind einen Einfluss auf die Traktionsenergie der Triebfahrzeuge und die Umgebungstemperatur hat einen Einfluss auf die ben\u00f6tigte Heiz- oder K\u00fchlenerg...","hashtag":"","id":297,"ident":null,"image_url":"https://opendata.utou.ch/goodrollin/Q.php?S","is_challenge":true,"is_webembed":false,"logo_color":"","logo_icon":"","longtext":"Der Energieverbrauch einer Zugfahrt h\u00e4ngt von vielen verschiedenen Einflussgr\u00f6ssen ab und kann stark variieren. Die Gesamtmasse, Streckenl\u00e4nge, Topologie (insbesondere Steigungen, Tunnel), der Geschwindigkeitsverlauf, Fahrzeugtechnik und nicht zuletzt die meteorologischen Umgebungsbedingungen sind die dominierenden Gr\u00f6ssen. Beim Wetter hat z.B. der Wind einen Einfluss auf die Traktionsenergie der Triebfahrzeuge und die Umgebungstemperatur hat einen Einfluss auf die ben\u00f6tigte Heiz- oder K\u00fchlenergie.\r\n\r\nDank verbesserter Kenntnis der Anteile einzelner Einflussgr\u00f6ssen am Gesamtenergieverbrauch k\u00f6nnen z.B. Energiesparmassnahmen identifiziert und umgesetzt werden oder bessere Leistungsprognosen von Zugfahrten erstellt werden (Lastmanagement bei SBB).\r\n \r\nEine detaillierte physikalische Modellierung der Witterungseinfl\u00fcsse ist sehr aufw\u00e4ndig. Ist es m\u00f6glich, mittels Machine Learning in einem vereinfachten Modell die wesentlichen Komponenten abzubilden und so die Prognose des Energieverbrauchs von Zugfahrten zu verbessern?\r\n\r\nF\u00fcr zwei ausgew\u00e4hlten Strecken (jeweils beide Richtungen) mit bestimmten Triebz\u00fcgen werden Verbrauchswerte und Meteodaten zur Verf\u00fcgung gestellt.\r\n\r\nIm Rahmen der Aufgabenstellung soll mit einem vereinfachten Modell gestartet werden, das zu Beginn den Einfluss eines Witterungsparameters (z.B. Umgebungstemperaturen) ber\u00fccksichtigt und sp\u00e4ter erweitert wird.","maintainer":"oleg","name":"Welchen Einfluss hat das Wetter auf deine Zugfahrt?","phase":"Challenge","progress":-1,"score":0,"source_url":"","stats":{"commits":0,"during":0,"people":1,"sizepitch":1393,"sizetotal":1510,"total":11,"updates":9},"summary":"Mittels Machine Learning den Einfluss der Umgebungsbedingungen auf den Energieverbrauch von Zugfahrten quantifizieren","team":"oleg, rschaefer","team_count":1,"updated_at":"2019-02-15T08:40","url":"https://hack.opendata.ch/project/297","webpage_url":""},{"autotext":"","autotext_url":"","category_id":34,"category_name":"Dienste & Kunden","contact_url":"","created_at":"2018-12-21T17:10","download_url":"","event_name":"Energy Data Hackdays 2019","event_url":"https://hack.opendata.ch/event/24","excerpt":"Bauherren und Investoren sind nur bedingt vertraut mit dem energetischen Umfeld des neuen Baulandes.\r\n\r\nDurch eine Energiekarte k\u00f6nnten Bauherren die Strom- und W\u00e4rmeversorgung entsprechend der Rahmenbedingungen des Baulandes (Gemeinde) und gem\u00e4ss den Bed\u00fcrfnissen optimieren. Sonneneinstrahlung auf der Parzelle, bestehende W\u00e4rme- und m\u00f6gliche Abw\u00e4rmequellen. Das Ziel sollte eine ganzheitliche Betrachtungsweise des Planungstools sein, die Sanierungsm\u00f6glichkeiten aufzeigt","hashtag":"","id":293,"ident":null,"image_url":"https://opendata.utou.ch/goodrollin/Q.php?N","is_challenge":true,"is_webembed":null,"logo_color":"","logo_icon":"","longtext":"Bauherren und Investoren sind nur bedingt vertraut mit dem energetischen Umfeld des neuen Baulandes.\r\n\r\nDurch eine Energiekarte k\u00f6nnten Bauherren die Strom- und W\u00e4rmeversorgung entsprechend der Rahmenbedingungen des Baulandes (Gemeinde) und gem\u00e4ss den Bed\u00fcrfnissen optimieren. Sonneneinstrahlung auf der Parzelle, bestehende W\u00e4rme- und m\u00f6gliche Abw\u00e4rmequellen. Das Ziel sollte eine ganzheitliche Betrachtungsweise des Planungstools sein, die Sanierungsm\u00f6glichkeiten aufzeigt","maintainer":"oleg","name":"Energieatlas","phase":"Challenge","progress":-1,"score":0,"source_url":"","stats":{"commits":0,"during":0,"people":0,"sizepitch":474,"sizetotal":500,"total":2,"updates":1},"summary":"Energieatlas f\u00fcr Bauherren","team":"oleg","team_count":0,"updated_at":"2019-02-12T12:59","url":"https://hack.opendata.ch/project/293","webpage_url":""},{"autotext":"","autotext_url":"","category_id":32,"category_name":"Produktion","contact_url":"","created_at":"2018-12-21T17:14","download_url":"","event_name":"Energy Data Hackdays 2019","event_url":"https://hack.opendata.ch/event/24","excerpt":"Wie schafft man es im Fall der SBB basierend auf den gesetzlichen M\u00f6glichkeiten, m\u00f6glichst grosse Areale zu identifizieren, die eine hohe Eignung f\u00fcr Stromerzeugung mittels Photovoltaik haben?\r\n\r\nDer Zusammenschluss zum Eigenverbrauch (ZEV) (neue gesetzliche Grundlage) bietet die M\u00f6glichkeit, dass die SBB vor Ort produzierte elektrische Energie in erster Priorit\u00e4t direkt nutzen kann - wenn Bedingungen erf\u00fcllt sind:\r\nDie PV-Anlage liegt hinter dem gleichen Netzanschluss wie die Verbraucher. Ein E...","hashtag":"","id":296,"ident":null,"image_url":"https://opendata.utou.ch/goodrollin/Q.php?R","is_challenge":true,"is_webembed":null,"logo_color":"","logo_icon":"","longtext":"Wie schafft man es im Fall der SBB basierend auf den gesetzlichen M\u00f6glichkeiten, m\u00f6glichst grosse Areale zu identifizieren, die eine hohe Eignung f\u00fcr Stromerzeugung mittels Photovoltaik haben?\r\n\r\nDer Zusammenschluss zum Eigenverbrauch (ZEV) (neue gesetzliche Grundlage) bietet die M\u00f6glichkeit, dass die SBB vor Ort produzierte elektrische Energie in erster Priorit\u00e4t direkt nutzen kann - wenn Bedingungen erf\u00fcllt sind:\r\nDie PV-Anlage liegt hinter dem gleichen Netzanschluss wie die Verbraucher. Ein Eigenverbrauch liegt vor, wenn der produzierte Strom auf dem Weg zum Verbraucher nicht \u00fcber Verteilnetz des Energieversorgers fliest. Und die Produktionsleistung der PV-Anlage liegt bei mindestens 10 Prozent der Anschlussleistung des Zusammenschlusses. Damit k\u00f6nnen die Geb\u00fchren der Netznutzung eingespart werden.\r\n","maintainer":"oleg","name":"Max PV-Strom SBB-Arealen","phase":"Challenge","progress":-1,"score":0,"source_url":"","stats":{"commits":0,"during":0,"people":1,"sizepitch":812,"sizetotal":931,"total":6,"updates":4},"summary":"Zusammenh\u00e4nge SBB Parzellen mittels GIS-Daten so zusammenschliessen, dass Solarpotenziale optimal genutzt werden k\u00f6nnen","team":"oleg, mruecker","team_count":1,"updated_at":"2019-02-13T15:14","url":"https://hack.opendata.ch/project/296","webpage_url":""},{"autotext":"","autotext_url":"","category_id":33,"category_name":"Netze","contact_url":"","created_at":"2018-12-18T13:14","download_url":"","event_name":"Energy Data Hackdays 2019","event_url":"https://hack.opendata.ch/event/24","excerpt":"Basierend auf Mikrozensusdaten ist in meinem Netzgebiet mit wie vielen eigenen und geteilten Fahrzeugen zu rechnen.\r\n\r\nVor dem Hintergrund einer zunehmenden Anzahl an neu zugelassenen Elektrofahrzeugen im Markt, einer Anpassung der Batteriekapazit\u00e4ten, einer Ver\u00e4nderung des Ladeverhaltens (public, home, office) stellt sich die Frage nach den zuk\u00fcnftigen lukrativen Stellpl\u00e4tzen. Welche Rolle spielen Verkehrsfl\u00fcsse und t\u00e4gliche Bewegungen von Personen und Fahrzeugen bei der Findung lukrativer Stel...","hashtag":"","id":281,"ident":null,"image_url":"https://opendata.utou.ch/goodrollin/Q.php?A","is_challenge":true,"is_webembed":null,"logo_color":"","logo_icon":"","longtext":"Basierend auf Mikrozensusdaten ist in meinem Netzgebiet mit wie vielen eigenen und geteilten Fahrzeugen zu rechnen.\r\n\r\nVor dem Hintergrund einer zunehmenden Anzahl an neu zugelassenen Elektrofahrzeugen im Markt, einer Anpassung der Batteriekapazit\u00e4ten, einer Ver\u00e4nderung des Ladeverhaltens (public, home, office) stellt sich die Frage nach den zuk\u00fcnftigen lukrativen Stellpl\u00e4tzen. Welche Rolle spielen Verkehrsfl\u00fcsse und t\u00e4gliche Bewegungen von Personen und Fahrzeugen bei der Findung lukrativer Stellpl\u00e4tze im eigenen Netzgebiet? Anzahl und Entwicklung der Fahrzeuge im Markt.\r\n\r\nWas sind entscheidende Faktoren dar\u00fcber, weshalb manche Stationen wirtschaftlich sind, w\u00e4hrend die meisten bisher installierten Ladestationen eher Werbezwecken dienen? Was ist der maximale Leistungsbezug (in kW) welcher sich dort ergeben kann?","maintainer":"oleg","name":"Standort planung","phase":"Challenge","progress":-1,"score":0,"source_url":"","stats":{"commits":0,"during":0,"people":0,"sizepitch":824,"sizetotal":849,"total":5,"updates":4},"summary":"Netzplanung Ladestationen","team":"oleg","team_count":0,"updated_at":"2019-02-12T12:56","url":"https://hack.opendata.ch/project/281","webpage_url":""},{"autotext":"","autotext_url":"","category_id":33,"category_name":"Netze","contact_url":"","created_at":"2018-12-21T17:05","download_url":"","event_name":"Energy Data Hackdays 2019","event_url":"https://hack.opendata.ch/event/24","excerpt":"Das Ziel des [Feldversuches VEiN](http://www.vein-grid.ch/projekt.html) war es, die Auswirkungen der vermehrten dezentralen Einspeisung auf die Netzqualit\u00e4t und auf den Betrieb von Niederspannungsnetzen in der Praxis zu ermitteln. Zudem diente das Projekt VEiN auch als Plattform f\u00fcr wissenschaftliche Versuche bez\u00fcglich der dezentralen Stromerzeugung.\r\n\r\nIm Rahmen des Projektes wurden viele Daten gesammelt und einige Erkenntnisse gewonnen. Welche Erkenntnisse ziehen die \u00abHacker\u00bb aus diesen Daten ...","hashtag":"","id":290,"ident":null,"image_url":"https://opendata.utou.ch/goodrollin/Q.php?K","is_challenge":true,"is_webembed":null,"logo_color":"","logo_icon":"","longtext":"Das Ziel des [Feldversuches VEiN](http://www.vein-grid.ch/projekt.html) war es, die Auswirkungen der vermehrten dezentralen Einspeisung auf die Netzqualit\u00e4t und auf den Betrieb von Niederspannungsnetzen in der Praxis zu ermitteln. Zudem diente das Projekt VEiN auch als Plattform f\u00fcr wissenschaftliche Versuche bez\u00fcglich der dezentralen Stromerzeugung.\r\n\r\nIm Rahmen des Projektes wurden viele Daten gesammelt und einige Erkenntnisse gewonnen. Welche Erkenntnisse ziehen die \u00abHacker\u00bb aus diesen Daten die auch f\u00fcr ein anderes Netzgebiet relevant sind?\r\n\r\nGleiche Daten, anderes Ergebnis? \u2013 Was bringt ein Perspektivwechsel?","maintainer":"oleg","name":"What do you see 2.0","phase":"Challenge","progress":-1,"score":0,"source_url":"","stats":{"commits":0,"during":0,"people":1,"sizepitch":622,"sizetotal":664,"total":3,"updates":1},"summary":"Dezentralen Einspeisung und Stromerzeugung","team":"oleg, derrickoswald","team_count":1,"updated_at":"2019-02-12T12:59","url":"https://hack.opendata.ch/project/290","webpage_url":""},{"autotext":"","autotext_url":"","category_id":34,"category_name":"Dienste & Kunden","contact_url":"","created_at":"2018-12-21T17:03","download_url":"","event_name":"Energy Data Hackdays 2019","event_url":"https://hack.opendata.ch/event/24","excerpt":"Schweizer Endkunden haben einen eher abstrakten Bezug zum Strom in ihrem Haushalt. \u00abStrom kommt aus der Steckdose\u00bb und das 24/7\u2026.eine Selbstverst\u00e4ndlichkeit. Wirklich?\r\n\r\nWas braucht es, um Strom sichtbarer und/oder pr\u00e4senter f\u00fcr den Endkunden zu machen? Kann man \u00abStrom\u00bb sexier\u00bb machen? Applikationen f\u00fcr den Haushalt? Gamification-Ans\u00e4tze oder spielerische Konkurrenz k\u00f6nnten ein L\u00f6sungsansatz sein. Aber wie gestaltet?\r\n\r\nWas braucht es Eurer Meinung nach, um die \u00abSchl\u00fcsselenergie der Zukunft\u00bb be...","hashtag":"","id":289,"ident":null,"image_url":"https://opendata.utou.ch/goodrollin/Q.php?J","is_challenge":true,"is_webembed":false,"logo_color":"","logo_icon":"","longtext":"Schweizer Endkunden haben einen eher abstrakten Bezug zum Strom in ihrem Haushalt. \u00abStrom kommt aus der Steckdose\u00bb und das 24/7\u2026.eine Selbstverst\u00e4ndlichkeit. Wirklich?\r\n\r\nWas braucht es, um Strom sichtbarer und/oder pr\u00e4senter f\u00fcr den Endkunden zu machen? Kann man \u00abStrom\u00bb sexier\u00bb machen? Applikationen f\u00fcr den Haushalt? Gamification-Ans\u00e4tze oder spielerische Konkurrenz k\u00f6nnten ein L\u00f6sungsansatz sein. Aber wie gestaltet?\r\n\r\nWas braucht es Eurer Meinung nach, um die \u00abSchl\u00fcsselenergie der Zukunft\u00bb beim Endkunden bewusster zu machen?","maintainer":"oleg","name":"Visistrom challenge","phase":"Challenge","progress":-1,"score":0,"source_url":"","stats":{"commits":0,"during":2,"people":1,"sizepitch":533,"sizetotal":562,"total":4,"updates":2},"summary":"\u00abDem Strom ein Gesicht geben\u00bb","team":"oleg, emilieboillat","team_count":1,"updated_at":"2019-02-16T01:05","url":"https://hack.opendata.ch/project/289","webpage_url":""},{"autotext":"","autotext_url":"","category_id":34,"category_name":"Dienste & Kunden","contact_url":"","created_at":"2018-12-18T13:16","download_url":"","event_name":"Energy Data Hackdays 2019","event_url":"https://hack.opendata.ch/event/24","excerpt":"Crowd-Energy & Peer-to-Peer-Modelle gelten als Enabler f\u00fcr Gesch\u00e4ftsmodelle der dezentralen Energieproduktion \r\n\r\n\u00dcber Gamification und die Nutzung von mobilen Applikationen und Social Media kann die Generation der Digital Natives in neuen Gesch\u00e4ftsmodellen involviert werden\r\n\r\nDie Endkunden in der Schweiz haben einen eher abstrakten Bezug zum Strom in ihrem Haushalt. Durch ihr Verhalten haben sie aber einen grossen Einfluss auf den Verbrauch und k\u00f6nnen Flexibilit\u00e4t zur Verf\u00fcgung stellen\r\n\r\nMitt...","hashtag":"","id":283,"ident":null,"image_url":"https://opendata.utou.ch/goodrollin/Q.php?C","is_challenge":true,"is_webembed":false,"logo_color":"","logo_icon":"","longtext":"Crowd-Energy & Peer-to-Peer-Modelle gelten als Enabler f\u00fcr Gesch\u00e4ftsmodelle der dezentralen Energieproduktion \r\n\r\n\u00dcber Gamification und die Nutzung von mobilen Applikationen und Social Media kann die Generation der Digital Natives in neuen Gesch\u00e4ftsmodellen involviert werden\r\n\r\nDie Endkunden in der Schweiz haben einen eher abstrakten Bezug zum Strom in ihrem Haushalt. Durch ihr Verhalten haben sie aber einen grossen Einfluss auf den Verbrauch und k\u00f6nnen Flexibilit\u00e4t zur Verf\u00fcgung stellen\r\n\r\nMittels einer App (Game, Notifications, was auch immer) k\u00f6nnte man den Kunden dazu bewegen sich netzdienlicher (oder systemdienlich) zu Verhalten und ihm auch transparent aufzeigen, was sein Nutzen durch z.B. tiefere Preise ist. Was w\u00e4re hier ein m\u00f6glicher Ansatz?\r\n\r\nAnhand von Wettervorhersagen kann die saubere Produktion im Voraus bewertet und festgestellt werden, ob es rentabler ist, die Batterie aufzuladen, den Strom an den Stromversorger weiterzuverkaufen oder zu diesem Zeitpunkt vor Ort zu verbrauchen\r\n\r\nImmer wichtigere Rolle des Endkunden bei voranschreitender Dezentralisierung der Energielandschaft\r\n\r\n**Wie sieht eine erfolgsversprechende L\u00f6sung aus, mit der ich vom Solarstrom oder dem Stromspeicher meines Nachbarn profitieren kann? Kann ich durch Absprache des Verbrauchs mit meinen Nachbarn einen besseren Strompreis erzielen? L\u00e4sst durch Machine-Learning ein System bereitstellen, dass dem Anwender aktiv Optimierungsvorschl\u00e4ge macht?**","maintainer":"oleg","name":"Gamification Verhalten","phase":"Challenge","progress":-1,"score":0,"source_url":"","stats":{"commits":0,"during":0,"people":1,"sizepitch":1454,"sizetotal":1511,"total":5,"updates":3},"summary":"Energiemanagement f\u00fcr Prosumer/Flexibistrom/Quartierstrom","team":"oleg, derrickoswald","team_count":1,"updated_at":"2019-02-14T22:11","url":"https://hack.opendata.ch/project/283","webpage_url":""},{"autotext":"","autotext_url":"","category_id":32,"category_name":"Produktion","contact_url":"","created_at":"2018-12-18T13:19","download_url":"","event_name":"Energy Data Hackdays 2019","event_url":"https://hack.opendata.ch/event/24","excerpt":"\u00a0Bei Grossanlagen zur Erzeugung erneuerbarer Energien wird die Produktionsleistung regelm\u00e4ssig \u00fcberpr\u00fcft, um den ROI zu gew\u00e4hrleisten. Anders bei Kleinanlagen!\r\n\u00a0\r\nEin Vergleich der prognostizierten Produktion auf der Grundlage vergangener meteorologischer Daten mit der tats\u00e4chlichen Produktion einer Solar- oder Windkraftanlage erm\u00f6glicht es, abzusch\u00e4tzen, ob eine Anlage fehlerhaft ist.\r\n\u00a0\r\nDies beschleunigt die Diagnose und begrenzt die mit einer Anlagefehlfunktion verbundenen wirtschaftlichen ...","hashtag":"","id":284,"ident":null,"image_url":"https://opendata.utou.ch/goodrollin/Q.php?D","is_challenge":true,"is_webembed":false,"logo_color":"","logo_icon":"","longtext":"\u00a0Bei Grossanlagen zur Erzeugung erneuerbarer Energien wird die Produktionsleistung regelm\u00e4ssig \u00fcberpr\u00fcft, um den ROI zu gew\u00e4hrleisten. Anders bei Kleinanlagen!\r\n\u00a0\r\nEin Vergleich der prognostizierten Produktion auf der Grundlage vergangener meteorologischer Daten mit der tats\u00e4chlichen Produktion einer Solar- oder Windkraftanlage erm\u00f6glicht es, abzusch\u00e4tzen, ob eine Anlage fehlerhaft ist.\r\n\u00a0\r\nDies beschleunigt die Diagnose und begrenzt die mit einer Anlagefehlfunktion verbundenen wirtschaftlichen Verluste.\r\n\u00a0\r\nApproach and visualization is requested \u2013 **Can you handle it?**","maintainer":"oleg","name":"Photovolatik-Diagnose","phase":"Challenge","progress":-1,"score":0,"source_url":"","stats":{"commits":0,"during":0,"people":2,"sizepitch":577,"sizetotal":629,"total":5,"updates":2},"summary":"Erkennung von Fehlfunktionen in kleinen Solaranlagen","team":"oleg, urs_lang, emilieboillat","team_count":2,"updated_at":"2019-02-14T22:10","url":"https://hack.opendata.ch/project/284","webpage_url":""},{"autotext":"","autotext_url":"","category_id":34,"category_name":"Dienste & Kunden","contact_url":"","created_at":"2018-12-21T17:34","download_url":"","event_name":"Energy Data Hackdays 2019","event_url":"https://hack.opendata.ch/event/24","excerpt":"`-->` **[PROJECT PAGE](https://hack.opendata.ch/project/344)**\r\n\r\n## Challenge description\r\n\r\nZiel von *What is Watt* ist es, alles mit allem zu vergleichen. Wie viel Energie verbraucht meine t\u00e4gliche Pendler-Zugfahrt? (12.8 kWh) Und wie oft kann ich mit dieser Energie heiss duschen? (9 Mal) Oder einen Stock mit dem Lift fahren? (1200 Mal) Es bleibt am Ende die Entscheidung der einzelnen Person, ob sie nun n\u00e4her zu ihrem Arbeitsort zieht oder weniger lang/heiss duscht, um Energie zu sparen. \r\n\r\n...","hashtag":"","id":299,"ident":null,"image_url":"https://opendata.utou.ch/goodrollin/Q.php?T","is_challenge":true,"is_webembed":false,"logo_color":"#eff8ff","logo_icon":"balance-scale","longtext":"`-->` **[PROJECT PAGE](https://hack.opendata.ch/project/344)**\r\n\r\n## Challenge description\r\n\r\nZiel von *What is Watt* ist es, alles mit allem zu vergleichen. Wie viel Energie verbraucht meine t\u00e4gliche Pendler-Zugfahrt? (12.8 kWh) Und wie oft kann ich mit dieser Energie heiss duschen? (9 Mal) Oder einen Stock mit dem Lift fahren? (1200 Mal) Es bleibt am Ende die Entscheidung der einzelnen Person, ob sie nun n\u00e4her zu ihrem Arbeitsort zieht oder weniger lang/heiss duscht, um Energie zu sparen. \r\n\r\nNat\u00fcrlich h\u00e4ngen die obigen Werte von der Pendlerstrecke, der Duschdauer und der Liftart ab. Und auch was verglichen werden soll, ist oft sehr individuell. *What is Watt* ist deshalb auf allen Ebenen als offene Plattform konzipiert:\r\n\r\n1. **Offene Daten** dienen als Grundlage zur Berechnung der Szenarien.\r\n2. Die **Berechnungsmodelle** sind offen und dokumentiert. Man kann sie somit nachvollziehen, kritisieren und verbessern.\r\n3. Das Resultat jedes Szenarios ist ein Wert in Kilowattstunden. **Neue Szenarien** lassen sich so leicht hinzuf\u00fcgen und mit allen bestehenden vergleichen.\r\n4. *What is Watt* stellt die Szenarien \u00fcber eine **offene API** zur Verf\u00fcgung. Damit k\u00f6nnen **unterschiedliche Interfaces** und Visualisierungen die Daten auf ganz verschiedenste Art zug\u00e4nglich machen.\r\n\r\nDa alle vier Ebenen offen sind, ist es jedem m\u00f6glich zu *What is Watt* beizutragen. Typischerweise ist es ein neues Szenario, das jemanden pers\u00f6nlich interessiert. Wie viel Energie zum Beispiel eine Bitcoin-Transaktion verbraucht. Oder die eine Modelleisenbahn. Oder die E-Gitarre.\r\n\r\nDie Teilnehmer der [Energy Data Hackdays](https://hack.opendata.ch/event/24) k\u00f6nnen sich auf jeder der vier Ebenen bet\u00e4tigen und einen Beitrag zur Plattform liefern. \r\n\r\n\r\nUnd wer sich nun fragt, wie viel Energie eine Bitcoin-Transaktion verbraucht, hier die Antwort:\r\n\r\n\r\n\r\n\r\n","maintainer":"oleg","name":"What is Watt challenge","phase":"Challenge","progress":-1,"score":0,"source_url":"","stats":{"commits":0,"during":0,"people":1,"sizepitch":2483,"sizetotal":2561,"total":27,"updates":25},"summary":"Den Energieverbrauch verschiedener Alltagsszenarien berechnen und vergleichen.","team":"oleg, jonasoesch","team_count":1,"updated_at":"2019-02-19T11:42","url":"https://hack.opendata.ch/project/299","webpage_url":"https://www.jonasoesch.ch/portfolio/what-is-watt"},{"autotext":"","autotext_url":"","category_id":33,"category_name":"Netze","contact_url":"","created_at":"2018-12-21T16:04","download_url":"","event_name":"Energy Data Hackdays 2019","event_url":"https://hack.opendata.ch/event/24","excerpt":"Blackoutrisiken sind insbesondere durch mangelnde regionale Produktion, fehlende Investitionen ins Leitungsnetz, die starken Schwankungen bei bestimmten Methoden der dezentralen Stromerzeugung mit erneuerbaren Energien oder externe Blackouts bedingt.\r\n\r\nNetze sind die Datenautobahnen und essentiell f\u00fcr die Gesellschaft. Querverbundsunternehmen unterhalten Netze in den Bereichen: Strom, Gas, W\u00e4rme/K\u00e4lte, Wasser, Abwasser und Telekommunikation.\r\n\r\nAber wo liegen unter Ber\u00fccksichtigung aller Netze ...","hashtag":"","id":287,"ident":null,"image_url":"https://opendata.utou.ch/goodrollin/Q.php?G","is_challenge":true,"is_webembed":null,"logo_color":"","logo_icon":"","longtext":"Blackoutrisiken sind insbesondere durch mangelnde regionale Produktion, fehlende Investitionen ins Leitungsnetz, die starken Schwankungen bei bestimmten Methoden der dezentralen Stromerzeugung mit erneuerbaren Energien oder externe Blackouts bedingt.\r\n\r\nNetze sind die Datenautobahnen und essentiell f\u00fcr die Gesellschaft. Querverbundsunternehmen unterhalten Netze in den Bereichen: Strom, Gas, W\u00e4rme/K\u00e4lte, Wasser, Abwasser und Telekommunikation.\r\n\r\nAber wo liegen unter Ber\u00fccksichtigung aller Netze in einem Netzgebiet liegen die neuralgischen Punkte? Unter Ber\u00fccksichtigung der jeweiligen Netzebene und Netzart, Topographie, Menge des jeweiligen Mediums, angeschlossene Verbraucher und Positionierung der Trafostationen. Wie kann die Karte gepflegt, bewirtschaftet aktualisiert etc. werden? Kann die zuk\u00fcnftige Netzplanung ber\u00fccksichtigt werden? Welche potenziellen \u00abGefahren\u00bb sollten ber\u00fccksichtigt werden?\r\n\r\nWie k\u00f6nnte eine solche Karte aussehen bzw. gestaltet werden?","maintainer":"oleg","name":"Blackout-Karte","phase":"Challenge","progress":-1,"score":0,"source_url":"","stats":{"commits":0,"during":0,"people":0,"sizepitch":973,"sizetotal":1019,"total":2,"updates":1},"summary":"Visualisierung Risikokarte/Vulnerability Netze","team":"oleg","team_count":0,"updated_at":"2019-02-12T13:00","url":"https://hack.opendata.ch/project/287","webpage_url":""},{"autotext":"","autotext_url":"","category_id":33,"category_name":"Netze","contact_url":"","created_at":"2018-12-21T16:07","download_url":"","event_name":"Energy Data Hackdays 2019","event_url":"https://hack.opendata.ch/event/24","excerpt":"Wie k\u00f6nnen f\u00fcr eine strategische Netzplanung, die immer mehr Erneuerbare Energien, Speicher und Elektromobilit\u00e4t zu ber\u00fccksichtigen hat, Berechnungsszenarien aussehen, die es dem Asset-Management erlaubt, die Realisierungswahrscheinlichkeit von neuen potentiellen Standorte f\u00fcr Ladestationen (\u00f6ffentlich, privat) und Speicherl\u00f6sungen und dezentralen Erzeugungsanlagen (Schwerpunkt PV) einfach zu berechnen, um daraus die Auswirkungen auf die Netzplanung effektiver absch\u00e4tzen zu k\u00f6nnen.\r\n\r\n### Challe...","hashtag":"","id":288,"ident":null,"image_url":"https://opendata.utou.ch/goodrollin/Q.php?I","is_challenge":true,"is_webembed":null,"logo_color":"","logo_icon":"","longtext":"Wie k\u00f6nnen f\u00fcr eine strategische Netzplanung, die immer mehr Erneuerbare Energien, Speicher und Elektromobilit\u00e4t zu ber\u00fccksichtigen hat, Berechnungsszenarien aussehen, die es dem Asset-Management erlaubt, die Realisierungswahrscheinlichkeit von neuen potentiellen Standorte f\u00fcr Ladestationen (\u00f6ffentlich, privat) und Speicherl\u00f6sungen und dezentralen Erzeugungsanlagen (Schwerpunkt PV) einfach zu berechnen, um daraus die Auswirkungen auf die Netzplanung effektiver absch\u00e4tzen zu k\u00f6nnen.\r\n\r\n### Challenge\r\n\r\n> M\u00f6gliche Form und Ausgestaltung eines Steuerungsalgorithmus f\u00fcr die Berechnung der Wahrscheinlichkeit von potentiellen Standorten f\u00fcr \u00f6ffentliche / private Ladestationen, Speicherl\u00f6sungen und dezentralen Produktionsanlagen Falls auf Grundlage der verf\u00fcgbaren Daten keine Absch\u00e4tzung gemacht werden kann.\r\n","maintainer":"oleg","name":"Steuerungs-algorithmen","phase":"Challenge","progress":-1,"score":0,"source_url":"","stats":{"commits":0,"during":0,"people":0,"sizepitch":812,"sizetotal":883,"total":4,"updates":3},"summary":"Herausforderung f\u00fcr Asset-Management mit den 3 \u00abD\u2019s\u00bb der Energiebranche","team":"oleg","team_count":0,"updated_at":"2019-02-12T13:03","url":"https://hack.opendata.ch/project/288","webpage_url":""},{"autotext":"","autotext_url":"","category_id":34,"category_name":"Dienste & Kunden","contact_url":"","created_at":"2018-12-21T17:13","download_url":"","event_name":"Energy Data Hackdays 2019","event_url":"https://hack.opendata.ch/event/24","excerpt":"Unterst\u00fctzt bei der Objektbegehung zur energetischen Beurteilung zur Erneuerung und Sanierung. K\u00f6nnte vielleicht je nach Tool auch ein Planungswerkzeug werden\r\n\r\nDie App erlaubt durch Photographie einer Szenerie, Licht, Raumsituation, Apparate Datenschilder, Konstruktionsdetails, Materialien und der Verwendung von Daten die eingegeben werden und \u00f6ffentlich zug\u00e4nglich sind eine Systemische Analyse. Vielleicht auch den Einbezug bestehender Simulationstools (Tachion)\r\n\r\nEs werden Sanierungsstrategi...","hashtag":"","id":295,"ident":null,"image_url":"https://opendata.utou.ch/goodrollin/Q.php?Q","is_challenge":true,"is_webembed":null,"logo_color":"","logo_icon":"","longtext":"Unterst\u00fctzt bei der Objektbegehung zur energetischen Beurteilung zur Erneuerung und Sanierung. K\u00f6nnte vielleicht je nach Tool auch ein Planungswerkzeug werden\r\n\r\nDie App erlaubt durch Photographie einer Szenerie, Licht, Raumsituation, Apparate Datenschilder, Konstruktionsdetails, Materialien und der Verwendung von Daten die eingegeben werden und \u00f6ffentlich zug\u00e4nglich sind eine Systemische Analyse. Vielleicht auch den Einbezug bestehender Simulationstools (Tachion)\r\n\r\nEs werden Sanierungsstrategien vorgeschlagen, Isolation, W\u00e4rmespeicher, PV, Energiemanager etc.\r\n\r\nWartungsarbeiten, Wartungspl\u00e4ne oder auch Systemeinstellung des bestehenden Systems werden vorgeschlagen.","maintainer":"oleg","name":"Energieberatung","phase":"Challenge","progress":-1,"score":0,"source_url":"","stats":{"commits":0,"during":0,"people":0,"sizepitch":676,"sizetotal":703,"total":2,"updates":1},"summary":"mit AR und Simulationstools","team":"oleg","team_count":0,"updated_at":"2019-02-12T13:05","url":"https://hack.opendata.ch/project/295","webpage_url":""},{"autotext":"","autotext_url":"","category_id":34,"category_name":"Dienste & Kunden","contact_url":"","created_at":"2018-12-21T17:10","download_url":"","event_name":"Energy Data Hackdays 2019","event_url":"https://hack.opendata.ch/event/24","excerpt":"# \u00abEnergie Comparis\u00bb\r\n\r\nDurch die Liberalisierung des Strommarktes wird mit einer Flut von Angeboten gerechnet, welche sich nur geringf\u00fcgig unterscheiden, jedoch durchaus nicht dasselbe sind. Diese App hilft den Kunden das richtige Angebot zu w\u00e4hlen\r\n\r\nZu ber\u00fccksichtigen sind \u00abKlimafreundlichkeit\u00bb (Klimagase, Abholzung etc.), \u00abUmweltbelastung sonst\u00bb (gemessen in UBP der Module, Wechselrichter, Windturbinen, Wasserkraft etc.), \u00abLokalit\u00e4t des Stroms\u00bb (Strom vom Solardach, Wind woher?, Speicherung ...","hashtag":"","id":294,"ident":null,"image_url":"https://opendata.utou.ch/goodrollin/Q.php?O","is_challenge":true,"is_webembed":null,"logo_color":"","logo_icon":"","longtext":"# \u00abEnergie Comparis\u00bb\r\n\r\nDurch die Liberalisierung des Strommarktes wird mit einer Flut von Angeboten gerechnet, welche sich nur geringf\u00fcgig unterscheiden, jedoch durchaus nicht dasselbe sind. Diese App hilft den Kunden das richtige Angebot zu w\u00e4hlen\r\n\r\nZu ber\u00fccksichtigen sind \u00abKlimafreundlichkeit\u00bb (Klimagase, Abholzung etc.), \u00abUmweltbelastung sonst\u00bb (gemessen in UBP der Module, Wechselrichter, Windturbinen, Wasserkraft etc.), \u00abLokalit\u00e4t des Stroms\u00bb (Strom vom Solardach, Wind woher?, Speicherung wo wie), \u00abSoziale Faktoren\u00bb (Kinderarbeit, Landschaft, Finanzierung etc.)\r\n\r\nKunde/Kundin k\u00f6nnte auch selber vorschlagen was er/sie m\u00f6chte:\r\n\r\n- CO2-freie Stromversorgung, CO2-negativ\r\n- Nur aus der Region, \u00d6komax\r\n- Soziomax, nur PV\r\n- nur Wind, \u2026\u2026\r\n\r\n# Challenge your neighbour \r\n\r\nSpielerische Konkurrenz funktioniert gut, wenn Gruppen gegeneinander antreten. Dies nun im Bereich Klimafootprint. Teams aus einem gr\u00f6sseren Unternehmen oder kleinere Unternehmen k\u00f6nnen hier gegeneinander antreten und w\u00e4hrend einer vereinbarten Zeit sich selber gegeneinander Optimieren\r\n\r\nDie Konkurrenz kann beinhalten: Mobilit\u00e4t der beteiligten Individuen (Bike to Work, \u00d6V to work, zu Fuss etc.), Ferien? \u2013 Holiday-Challenge?, Geb\u00e4ude Arbeit/Privat, Aktionsvorschl\u00e4ge, wer macht was? Energiemix, Aktionsvorschl\u00e4ge, wer macht was? Etc\r\n\r\nK\u00f6nnte vielleicht auch zur Gemeinde-Challenge oder City-Challenge ausgebaut werden\r\n\r\nErstellung einer \u00abEnergiekarte\u00bb um die Auswirkungen unserer t\u00e4glichen Entscheidungen auf das Klima aufzuzeigen und zu visualisieren. Das Ziel w\u00e4re ein interkantonaler \u00abWettbewerb\u00bb zur Steigerung der Anteile erneuerbarer Energien in allen Bereichen (W\u00e4rme, Strom, Mobilit\u00e4t, \u2026.). > vgl. electricitymap.org","maintainer":"oleg","name":"Energie Footprint","phase":"Challenge","progress":-1,"score":0,"source_url":"","stats":{"commits":0,"during":0,"people":0,"sizepitch":1715,"sizetotal":1760,"total":3,"updates":2},"summary":"\u00abEnergie Comparis\u00bb / Challenge your neighbour","team":"oleg","team_count":0,"updated_at":"2019-02-12T13:02","url":"https://hack.opendata.ch/project/294","webpage_url":""},{"autotext":"","autotext_url":"","category_id":34,"category_name":"Dienste & Kunden","contact_url":"","created_at":"2018-12-21T17:35","download_url":"","event_name":"Energy Data Hackdays 2019","event_url":"https://hack.opendata.ch/event/24","excerpt":"Geb\u00e4udebesitzer sollten Geb\u00e4udedaten erheben und abspeichern. Diese Daten sollten z.B. als Faktenblatt als Offertgrundlagen weitergegeben werden k\u00f6nnen oder als Lebenslauf des Geb\u00e4udes archiviert werden um zuk\u00fcnftige Modernisierungsphasen zu planen\r\n\r\nDurch statistische Auswertungen von zus\u00e4tzlichen Daten soll die Wirtschaftlichkeit von Massnahmen f\u00fcr den Hausbesitzer sichtbar gemacht werden und Sanierungen effizienter gestaltet werden k\u00f6nnen. Unwirtschaftliche Investitionen sollen vermieden wer...","hashtag":"","id":300,"ident":null,"image_url":"https://opendata.utou.ch/goodrollin/Q.php?U","is_challenge":true,"is_webembed":false,"logo_color":"","logo_icon":"","longtext":"Geb\u00e4udebesitzer sollten Geb\u00e4udedaten erheben und abspeichern. Diese Daten sollten z.B. als Faktenblatt als Offertgrundlagen weitergegeben werden k\u00f6nnen oder als Lebenslauf des Geb\u00e4udes archiviert werden um zuk\u00fcnftige Modernisierungsphasen zu planen\r\n\r\nDurch statistische Auswertungen von zus\u00e4tzlichen Daten soll die Wirtschaftlichkeit von Massnahmen f\u00fcr den Hausbesitzer sichtbar gemacht werden und Sanierungen effizienter gestaltet werden k\u00f6nnen. Unwirtschaftliche Investitionen sollen vermieden werden\r\n\r\nBasierend auf Geb\u00e4udedaten werden Sanierungsstrategien vorgeschlagen","maintainer":"oleg","name":"Geb\u00e4ude-pass","phase":"Challenge","progress":-1,"score":0,"source_url":"","stats":{"commits":0,"during":0,"people":0,"sizepitch":575,"sizetotal":619,"total":3,"updates":2},"summary":"Geb\u00e4udepass oder \u00abLebenslauf\u00bb eines Geb\u00e4udes ","team":"oleg","team_count":0,"updated_at":"2019-02-14T22:11","url":"https://hack.opendata.ch/project/300","webpage_url":""},{"autotext":"","autotext_url":"","category_id":34,"category_name":"Dienste & Kunden","contact_url":"","created_at":"2018-12-21T17:08","download_url":"","event_name":"Energy Data Hackdays 2019","event_url":"https://hack.opendata.ch/event/24","excerpt":"Aktuelle Kundenportale wie das Luca Portal bieten allg. Informationen und Energiespartipps. Als Nutzer erhalte ich auf Fragen (noch) kein Feedback in Echtzeit und eingeschr\u00e4nkte Interaktionsm\u00f6glichkeit.\r\n\r\nDie Herausforderung liegt in der Nutzung von Chatbot-Technologien. Der Kunde sollte die M\u00f6glichkeit haben, Fragen zu stellen, die in einer \u00fcberschaubaren Zeit (im Idealfall auch automatisiert) beantwortet werden k\u00f6nnen. Ein direktes Feedback auf Anfragen sollte erm\u00f6glicht werden. Ein erweitert...","hashtag":"","id":292,"ident":null,"image_url":"https://opendata.utou.ch/goodrollin/Q.php?M","is_challenge":true,"is_webembed":false,"logo_color":"","logo_icon":"","longtext":"Aktuelle Kundenportale wie das Luca Portal bieten allg. Informationen und Energiespartipps. Als Nutzer erhalte ich auf Fragen (noch) kein Feedback in Echtzeit und eingeschr\u00e4nkte Interaktionsm\u00f6glichkeit.\r\n\r\nDie Herausforderung liegt in der Nutzung von Chatbot-Technologien. Der Kunde sollte die M\u00f6glichkeit haben, Fragen zu stellen, die in einer \u00fcberschaubaren Zeit (im Idealfall auch automatisiert) beantwortet werden k\u00f6nnen. Ein direktes Feedback auf Anfragen sollte erm\u00f6glicht werden. Ein erweitertes Ziel w\u00e4re sicherlich, zus\u00e4tzliche Informationen vom Kunden (durch nachfragen der Bots) zu erhalten","maintainer":"oleg","name":"Virtueller Effizienz-berater","phase":"Challenge","progress":-1,"score":0,"source_url":"","stats":{"commits":0,"during":0,"people":1,"sizepitch":601,"sizetotal":663,"total":6,"updates":4},"summary":"Basierend auf Verbrauchsprofilen und Informationen \u00fcber den HH","team":"oleg","team_count":1,"updated_at":"2019-02-14T22:12","url":"https://hack.opendata.ch/project/292","webpage_url":""}],"name":"projects"}],"sources":[{"path":"https://dribdat.cc","title":"dribdat"}],"title":"Energy Data Hackdays 2019","version":"0.2.0"}A single bitcoin transaction uses the same amount of electricity as 176 hot showers. So enjoy one more month of showering this year instead of shopping in bitcoin ;-) pic.twitter.com/iVKOGbEems
— Jonas Oesch (@jonasoesch) May 21, 2018