
Read your own Smart Meter
Lokale Schnittstelle zu Smart Meter inkl. Darstellung auf Web Oberfläche


(English below) #Eigenen Smart Meter auslesen (#3)
Ziel
Eigenen Smart Meter durch die lokale Customer Information Interface (CII) Schnittstelle auslesen und Stromverbrauch visualisieren. Dashboard mit den wichtigsten Informationen gestalten.
Idee
Zwei Smart Meter werden vor Ort installiert und werden den Verbrauch von unterschiedlichen Geräten messen. Der Live-Verbrauch wird auf einem web-basierten Dashboard visualisiert. Live-Werte werden mit historischen Daten kombiniert. Am Ende kann das Dashboard einer Person klare Auskunft über die wichtigsten Informationen bezüglich des Stromverbrauchs geben.
##Warum: In der Schweiz ist es gesetzlich vorgeschrieben, dass alle Smart Meter, die von Energieversorgern installiert werden, eine lokale Schnittstelle (CII) haben, so dass die Kunden Zugriff auf die eigenen Daten haben können. Das schafft mehr Transparenz, da die Kunden ihre eigenen Daten managen können. Innovation wird ermöglicht, weil genaue Daten neu gratis in Echtzeit verfügbar sind.
##Data:
- Live-Messungen mit Hilfe von Smart Metern
- Historische Daten Testanlage EKZ
- Eine kurze Einführung zu den Kommunikationsprotokollen der Smart Meters findet man hier: https://icube.ch/DLMSSurvivalKit/dsk1.html
#Read your own Smart Meter
##Goal: Read your Smart Meter through the local Customer Information Interface (CII) and visualize your consumption. Design a dashboard with the most useful information.
Idea:
Two Smart Meters will be installed on-site and will be measuring the consumption of different devices. The live consumption is to be displayed on a web-based dashboard. Live measurements are to be combined with historical data. At the end, the dashboard will be able to display the most important information to an individual about their electricity consumption.
##Why: In Switzerland, it is prescribed by law that all electricity Smart Meters installed by utilities must have a local interface (CII), so that customers can have access to their own data. Transparency is increased as individuals can manage their own data. Innovation is promoted, as precise data is available for free in real time.
See also Challenge 582: "Unleashing the Swiss Smartmeter's CII"
##Data:
- Live measurements from Smart Meters
- Historical data of an EKZ test site
- Short introduction to Smart Meter communication protocols can be found here: https://icube.ch/DLMSSurvivalKit/dsk1.html
Members of the team: Moritz Bolli Peter Zbinden Derrick Oswald Hubert Kirrmann Hermann Hueni Angelos Selviaridis Christos Konstantinopoulos
28.08.2020 14:34
The team will focus on moving data from the metering system and visualizing the data graphically. It will not rewrite the existing proprietary components.
28.08.2020 14:38
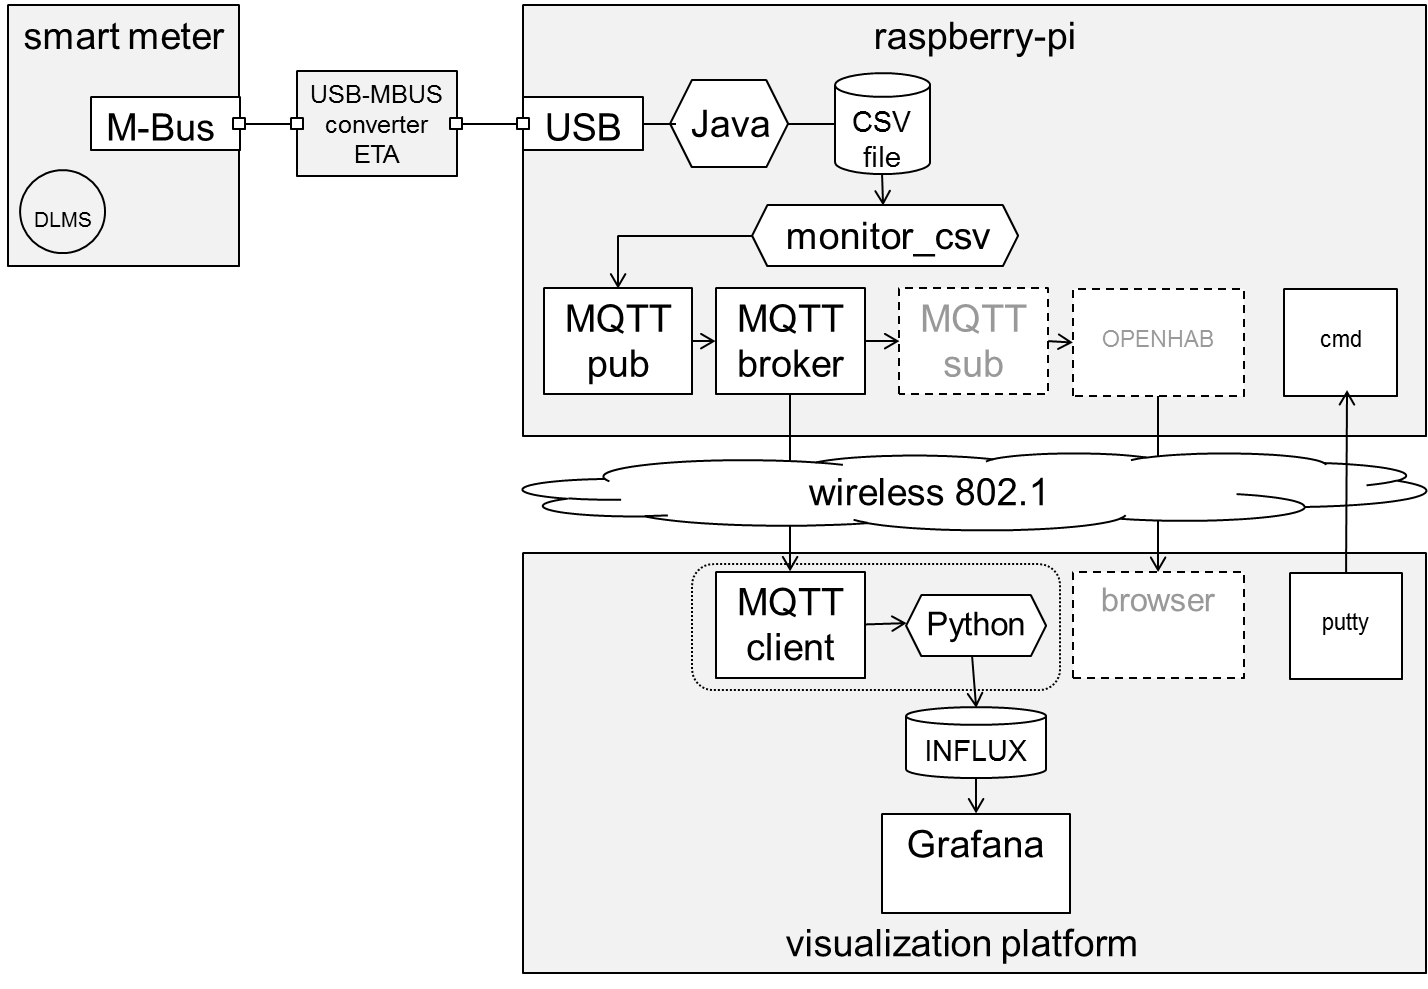
A quick prototype system has been constructed. There is a MQTT broker installed on the Raspberry Pi. It is fed by a bash script that monitors the log file of the proprietary software and publishes on four topics at roughly 5 second intervals:
- smart_meter_events/raw sends messages containing the text of each new line in the proprietary software CSV file
- smart_meter_events/voltage sends a time stamp and the voltage
- smart_meter_events/pf sends a time stamp and the power factor
- smart_meter_events/power sends a time stamp and the power MQTT clients, for example on members laptops, subscribe to the above topics and reports the messages as they are received. Graphing software has been prototypes to display the time series (sample data).
28.08.2020 14:42
OpenHUB 2 has been installed, and still being worked on, but as yet not successful.
28.08.2020 14:53
Initial success in reading the data and transferring it to a PC has been demonstrated.
28.08.2020 14:55
Smart meter readings are saved to the InfluxDB database by a MQTT <=> InfluxDB bridge python script.
28.08.2020 17:35
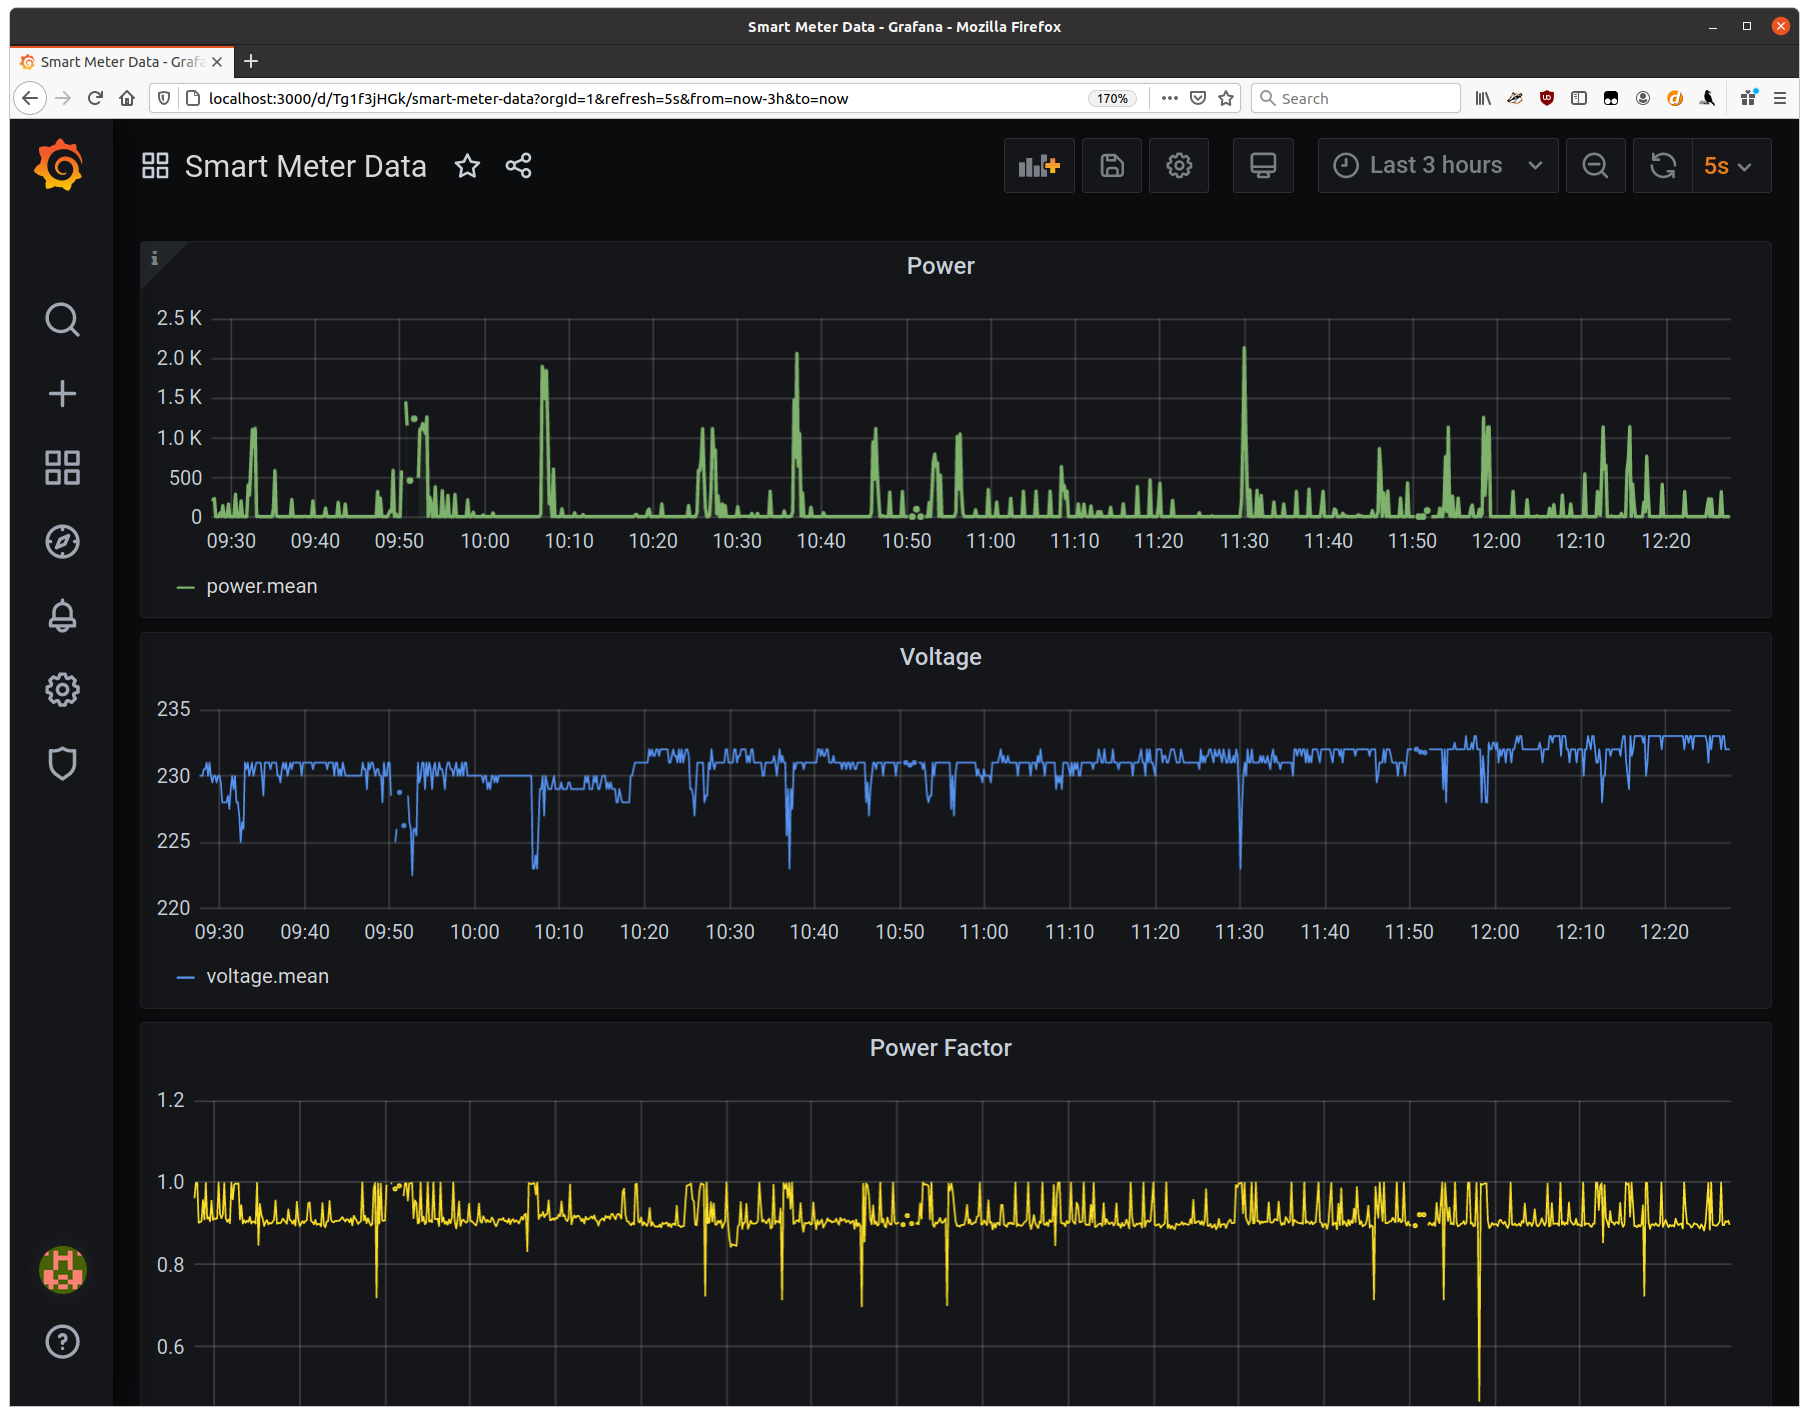
The first successful dashboard has been created with Grafana.
28.08.2020 18:18
Presented at Open Energy Data Hack Days - Saturday, 29 August, 2020
01.09.2020 05:58
Source code is available, per the Source link.
01.09.2020 06:00
CII Read Your Smart Meter
Read your own smart meter and visualize your electricity consumption. Create dashboards with valuable information and share it!
Goal
Read your Smart Meter through the local Customer Information Interface (CII) and visualize your consumption. Design a dashboard with the most useful information.
Idea
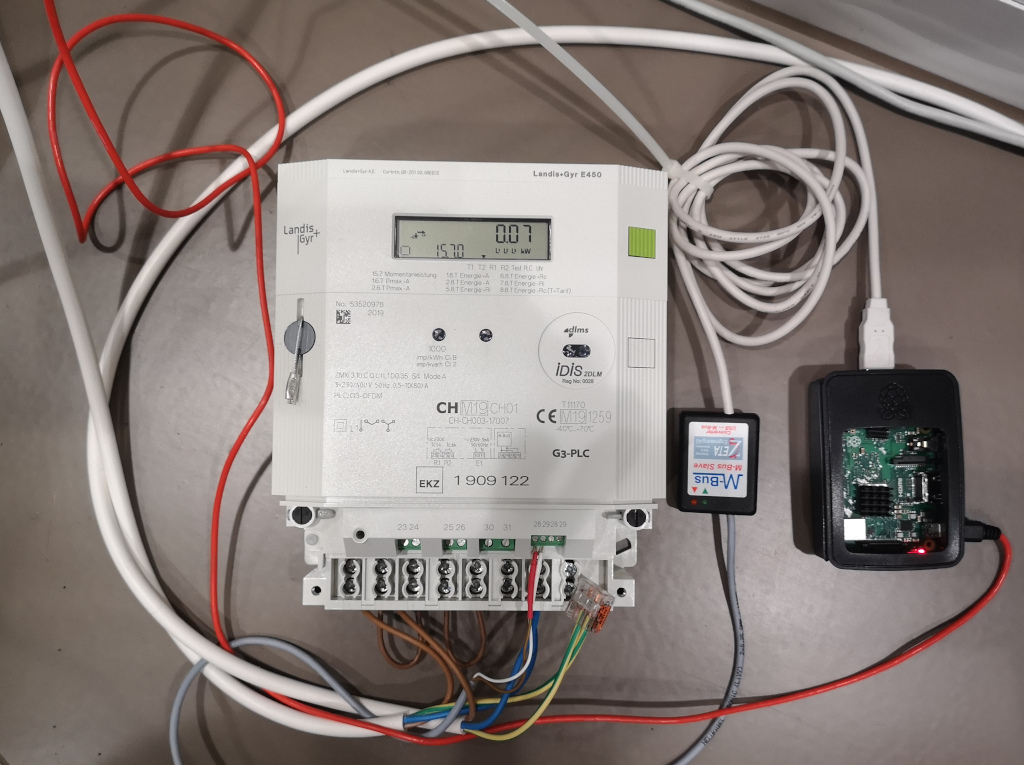
Two Smart Meters (Landis+Gyr E450)
will be installed on-site and will be measuring the consumption of different devices.
The live consumption is to be displayed on a web-based dashboard.
Ideally, live measurements are to be combined with historical data.
At the end, the dashboard will be able to display the most important information to an individual about their electricity consumption.
 .
.
Why
In Switzerland, it is prescribed by law that all electricity Smart Meters installed by utilities must have a local interface (CII), so that customers can have access to their own data. Transparency is increased as individuals can manage their own data. Innovation is promoted, as precise data is available for free in real time.
Data
Live measurements from Smart Meters Historical data of an EKZ test site
Architecture Diagram
Setup Procedure
The setup basically follows the approach outlined in two DIY IoT blog posts (Connect Raspberry Pi to MQTT and Display using InfluxDB and Grafana)
Raspberry Pi
Connecting to the Raspberry Pi requires knowing its IP address. This was provided access the existing Team-Viewer installation. Access to a bash session on the Pi can then be obtained with ssh or Putty. For example:
ssh pi@172.28.255.239
Mosquitto
MQTT broker and client software.
Install the MQTT (Message Queuing Telemetry Transport) broker and client on the Raspberry Pi:
sudo apt-get install mosquitto mosquitto-clients
MQTT publish
Bash script file change notification tool.
Rather than write a program that would replace the proprietary jar file, a simpler bash script approach was used. This requires a way to trigger commands when the contents of the CSV file being written by the proprietary jar file changes. Although there are many solutions, the inotify approach was used.
sudo apt-get install inotify-tools
Then run the bash script monitor_csv on the Raspberry Pi:
./monitor_csv
Client Computer
InfluxDB
Time series database.
The smart meter measurement events are stored in an InfluxDB database.
sudo apt-get install influxdb influxdb-client
Run the MQTTInfluxDBBridge.py python script to start moving the MQTT messages into the InfluxDB:
python3 MQTTInfluxDBBridge.py
After a few messages are processed, the database can be exercised with the influx command line tool:
$ influx
> use smartmeter
> show measurements
name: measurements
name
----
pf
power
voltage
> select * from voltage;
name: voltage
time                timestamp           voltage
----                ---------           -------
1598634419180514187 28.08.2020 19:06:59 229
1598634424287928040 28.08.2020 19:07:04 231
...
> select * from pf;
name: pf
time                pf    timestamp
----                --    ---------
1598634419180514187 0.912 28.08.2020 19:06:59
1598634424287928040 0.91  28.08.2020 19:07:04
...
> select * from power;
name: power
time                power timestamp
----                ----- ---------
1598634419180514187 10    28.08.2020 19:06:59
1598634424287928040 11    28.08.2020 19:07:04
...
Grafana
Time series visualization software.
Follow the instructions:
sudo apt-get install -y adduser libfontconfig1
wget https://dl.grafana.com/oss/release/grafana_7.1.5_amd64.deb
sudo dpkg -i grafana_7.1.5_amd64.deb
sudo service grafana-server start
Then browse to Grafana and login (username: admin, password: admin). The Explorer tab lets you make ad-hoc queries, and the Dashboards tab lets you create a dashboard using a nice GUI.
UI
 The contents of this website, unless otherwise stated, are licensed under a Creative Commons Attribution 4.0 International License.
Previous
Energy Hackdays 2020
Next project