


(English below) #Analyse E-Mobilitätsverhalten (#5) ##Ziel: Antworten auf Fragen bezüglich Mobilitäts- und Ladeverhalten in der neuen Ära der Elektromobilität. ##Idee: Öffentliche und historische Daten analysieren, um Klarheit bezüglich des Themas Elektroautos zu schaffen und Fragen beantworten, wie:
- Wie und wann bewegen sich Menschen heute?
- Wie, wann und wo laden Elektroautofahrer ihre Autos?
- Wie vergleicht sich eine öffentliche mit einer privaten Ladestation bezüglich Nutzung, Nutzungszeit, Nutzungsdauer usw.?
- …? ##Warum? Die heutige Situation der Elektromobilität verstehen, so dass man sich die Zukunft vorstellen kann und den benötigten Infrastrukturausbau (Verteilnetz, private Ladeinfrastruktur zu Hause) planen kann. ##Daten:
- Anonymisierte Profile von privaten Ladestationen in Mehrfamilienhäusern
- Historische Daten von öffentlichen Ladestationen aus ich-tanke-strom.ch (10GB Daten Feb. - Aug. 2020)
- Öffentliche Daten aus anderen Quellen
#E-Mobility behavior analysis ##Goal: Find answers to questions regarding mobility and charging behavior in the new era of electric mobility. ##Idea: Analyze open and historical data to get a clear understanding of the situation regarding electric cars by answering questions like the following:
- How and when do people move?
- How, when and where do people charge their electric cars?
- How does a public charging station compare to a private one in terms of utilization, time of use etc.?
- …?
##Big Picture: Understand the present situation regarding electric mobility in order to be able to imagine how the future will look like and plan the infrastructure development needed (electrical distribution grid, charging infrastructure at home) accordingly.
##Data:
- Anonymized profiles of private charging stations in multi-family homes
- Historical data of public charging stations from ich-tanke-strom.ch (10GB of data from Feb. to Aug. 2020)
- Open data from other sources
28.08.2020 13:24
28.08.2020 17:34 mockup for our emobility behaviour dashboard done.
29.08.2020 13:11 presentation & live demo of our amazing dashboard
Energy Hackdays 2020 Group 05 e-mobility behavior analysis
Erica Lastufka, physics @ www.fhnw.ch | Florence Meier, Full Stack Developmant (focus on frontend) | Benedikt Ramsauer, Data Scientist @ www.swiss-sdi.ch | Xavier Bays, Data Scientist @ www.swiss-sdi.ch | Tim Breitenbach, Analytics & Data Architect @ www.axpo.ch | Pradip Ravichandran, Computer Science @ www.fhnw.ch | Thilo Weber, Data Scientist @ www.geoimpact.ch | David Suter, Sustainable Energy Specialist @ www.geoimpact.ch
Dashboard Sreenshots
findings
public ev charging station
- Typology of municipalities is an important feature for occupied ratio
- highest occupied ratio in big centers and peri-urban rural communes
- no correlation between population density and occupied ratio
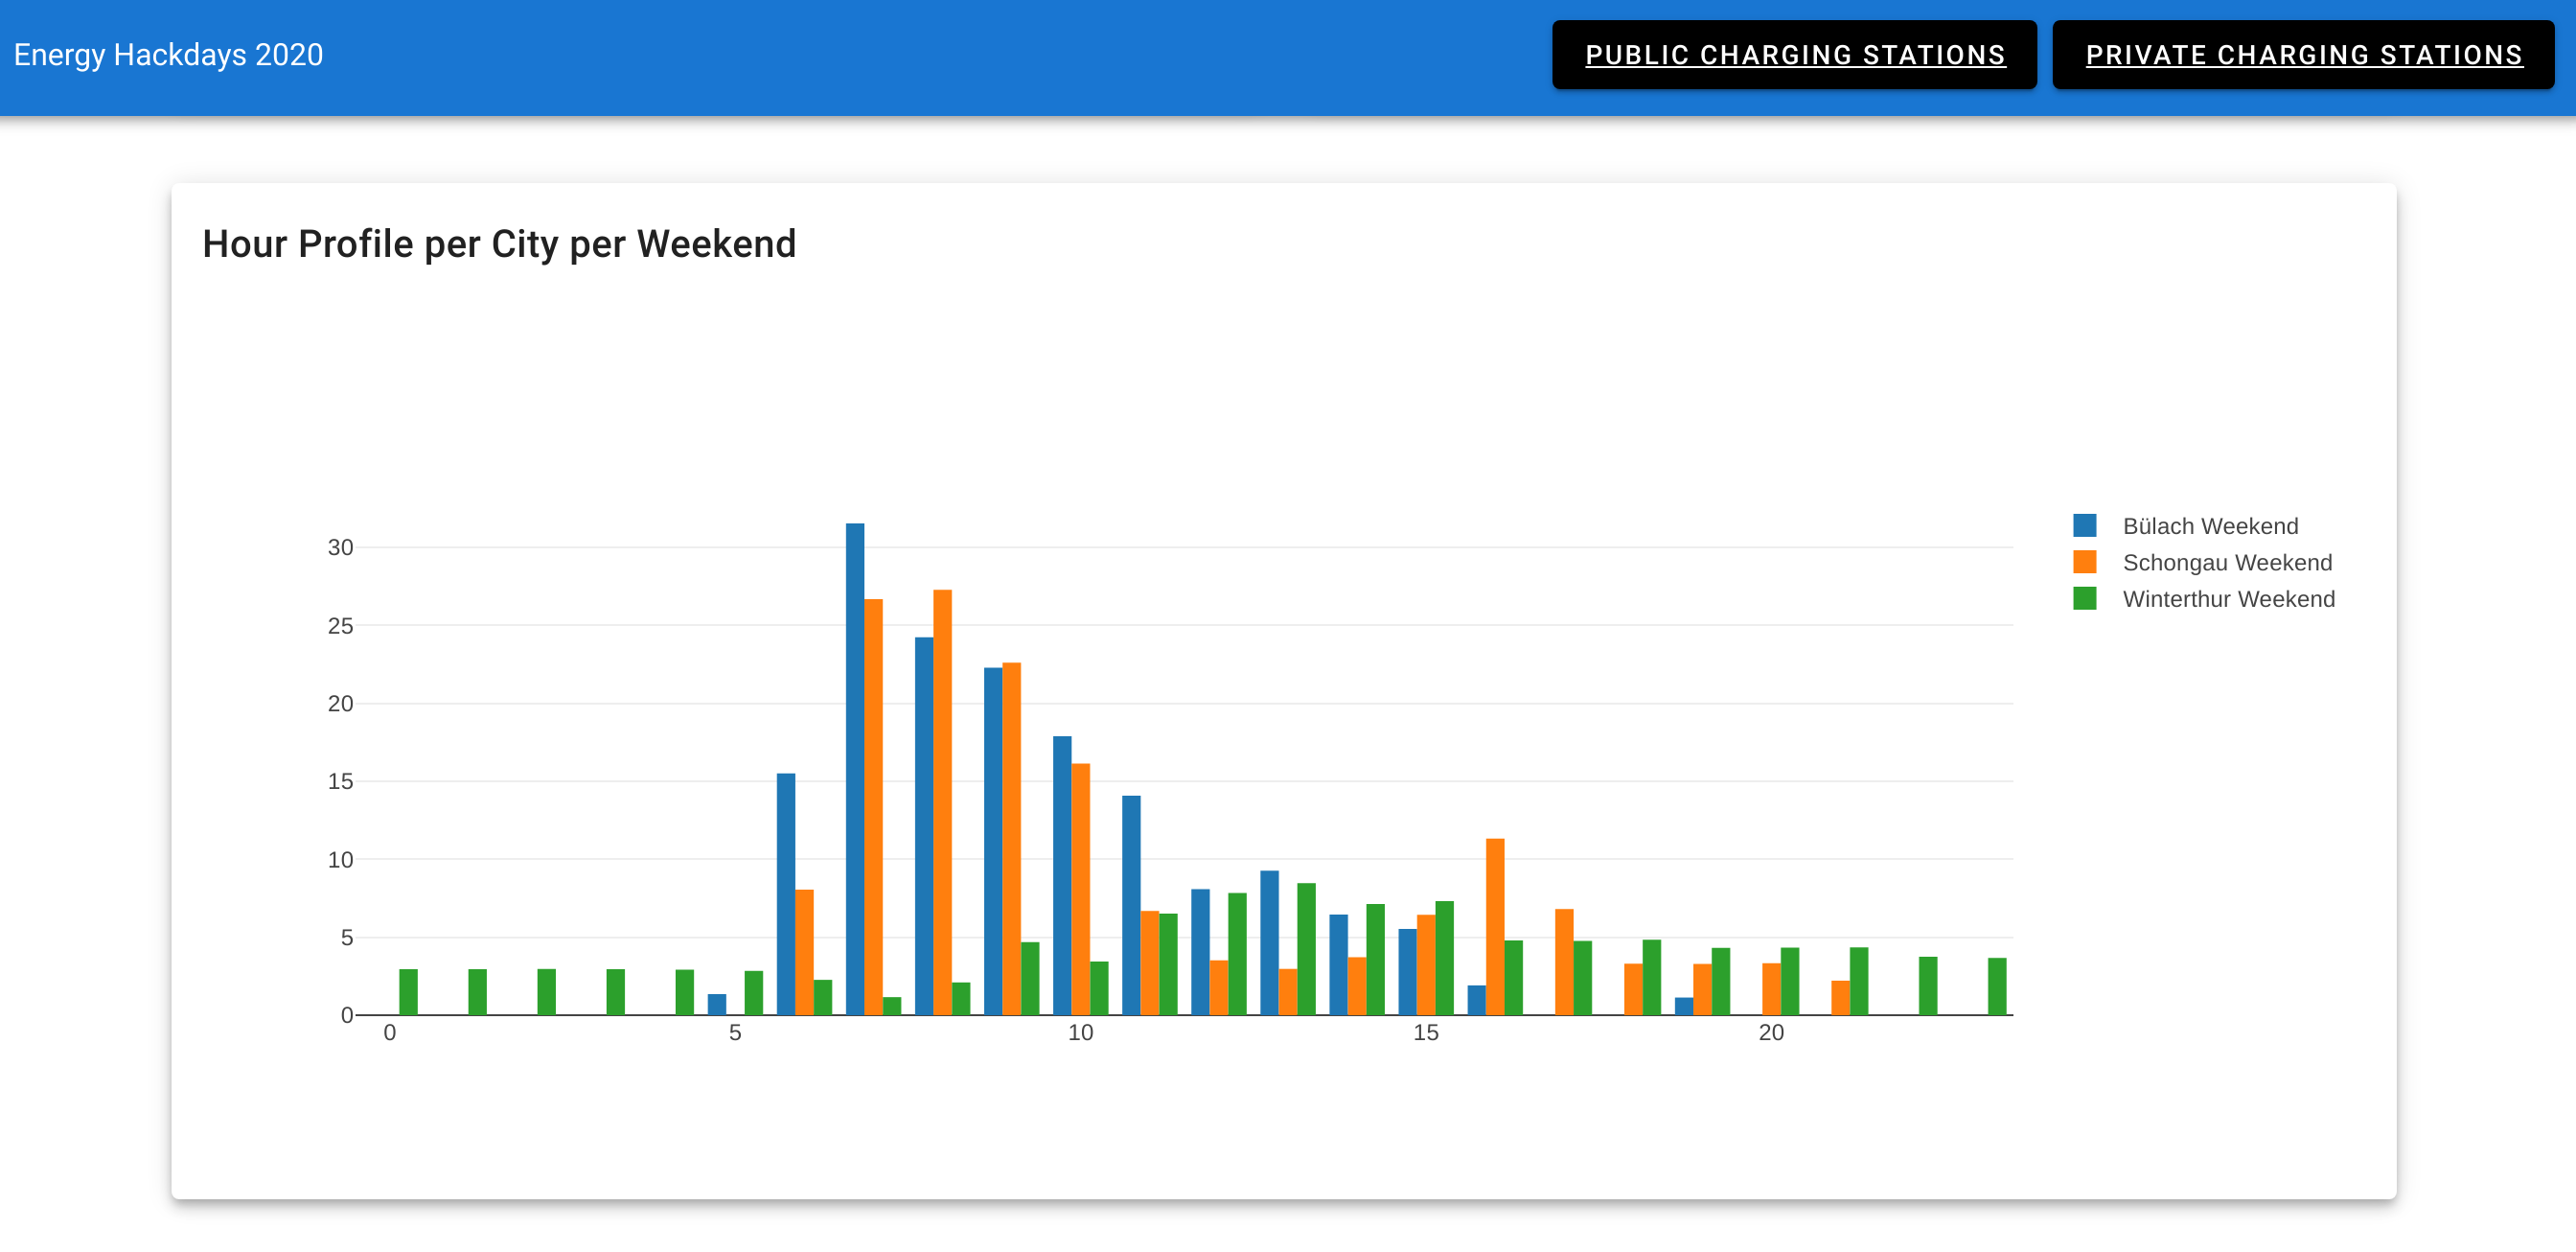
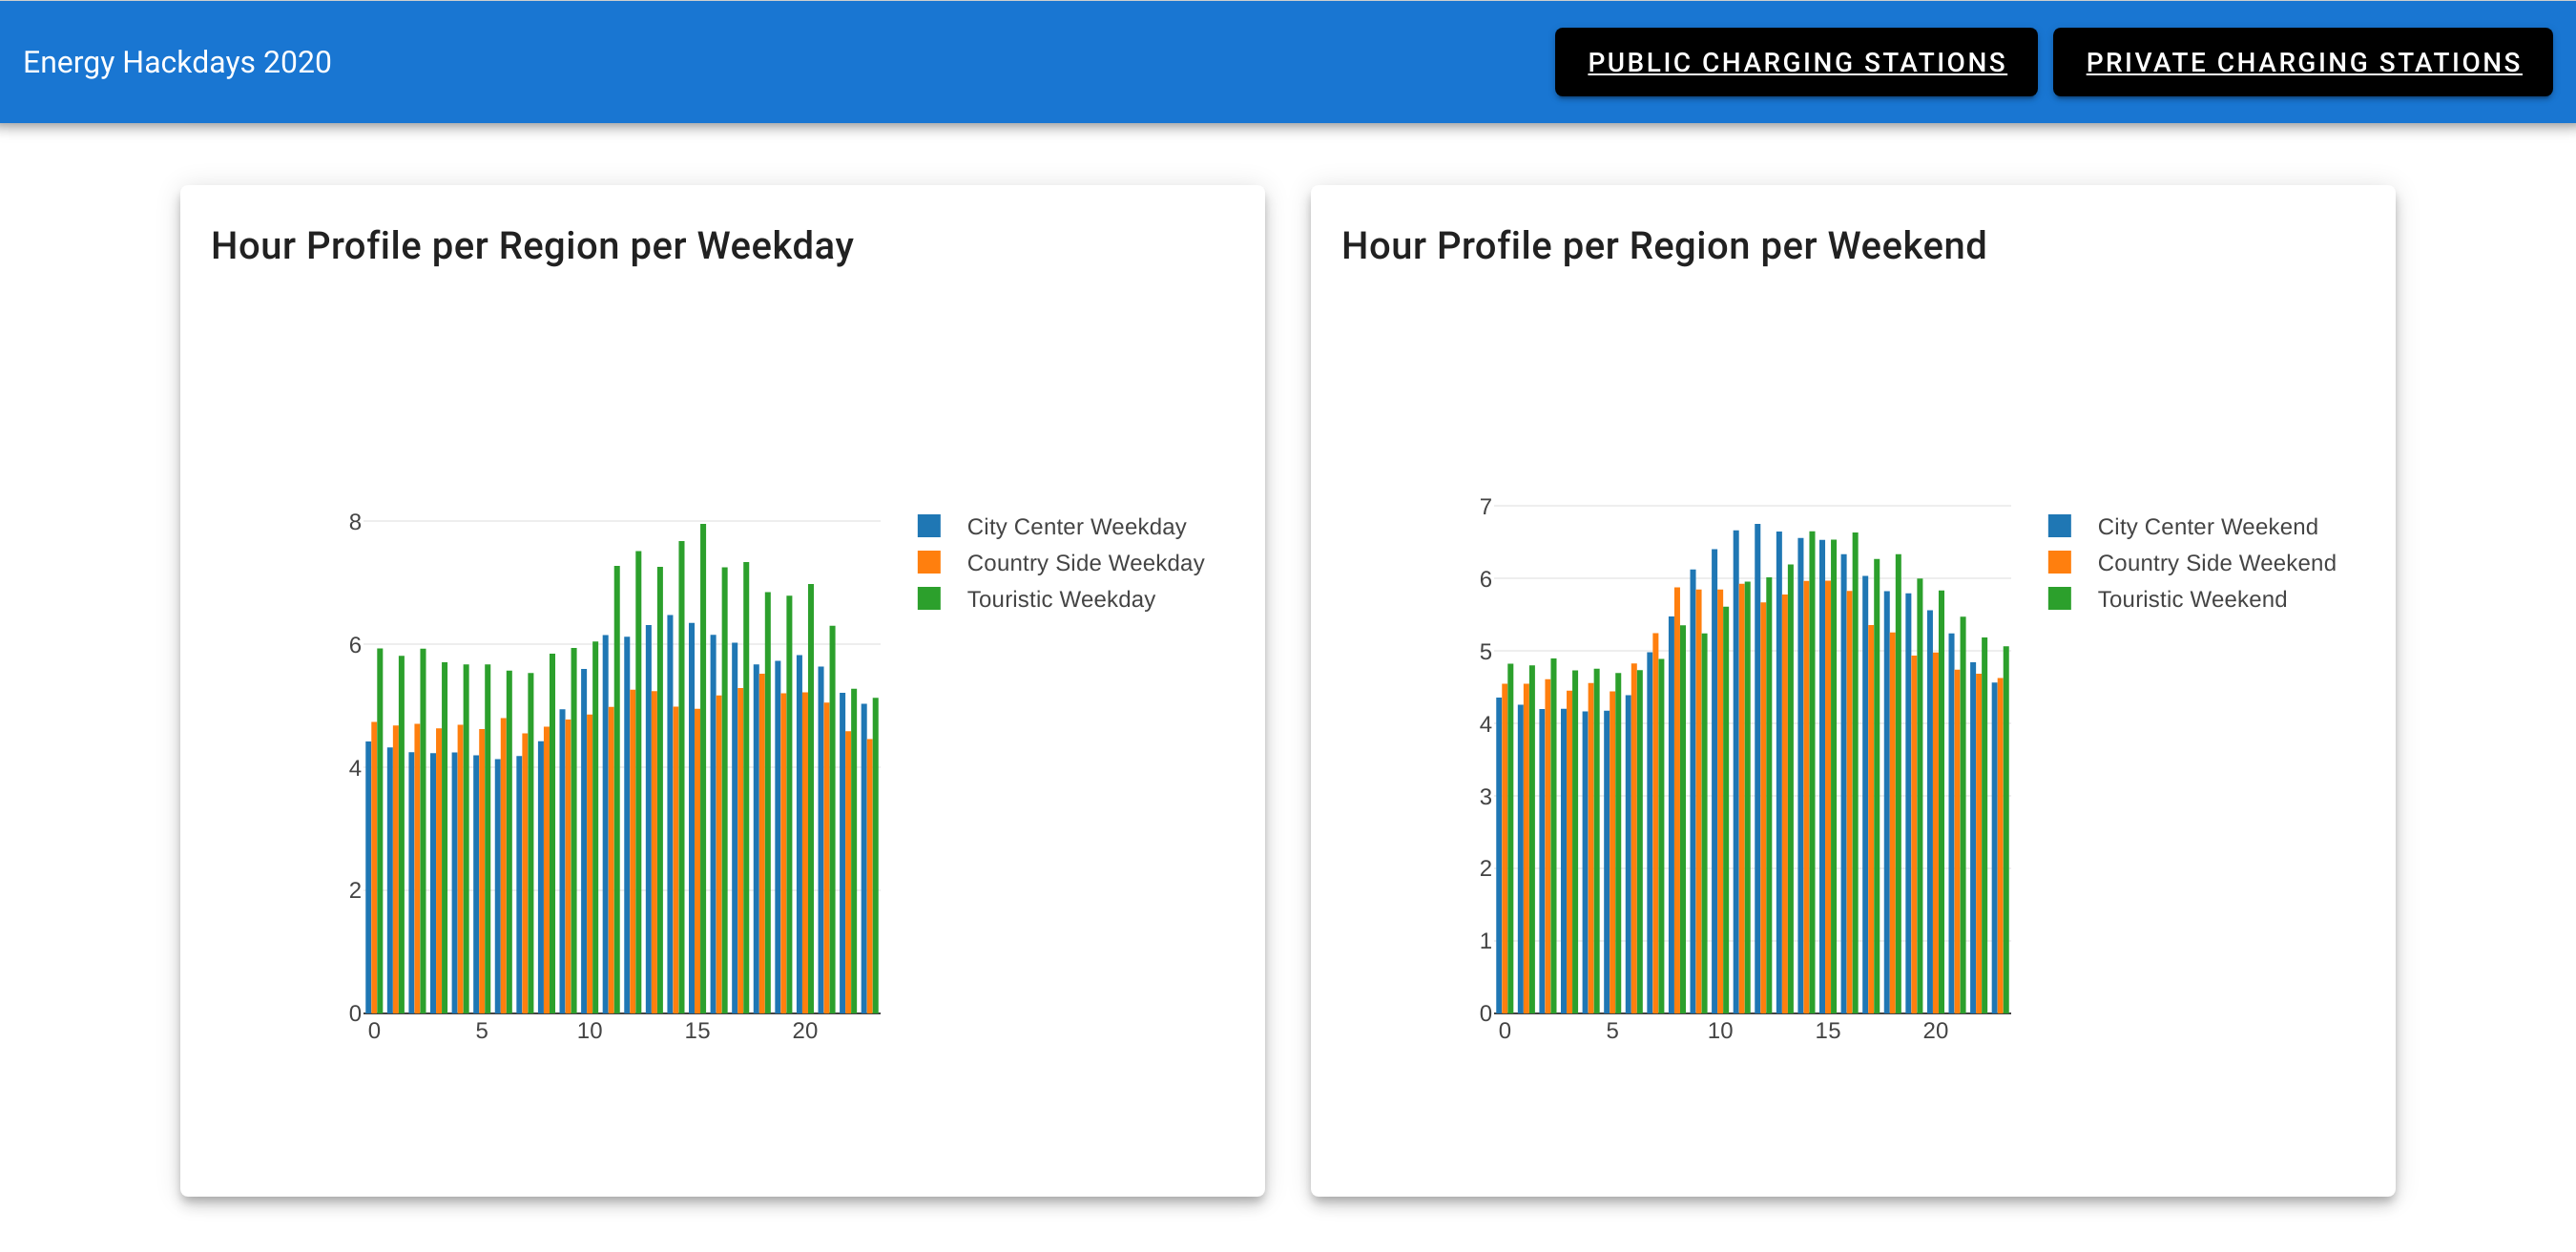
- different patterns on weekdays and weekends
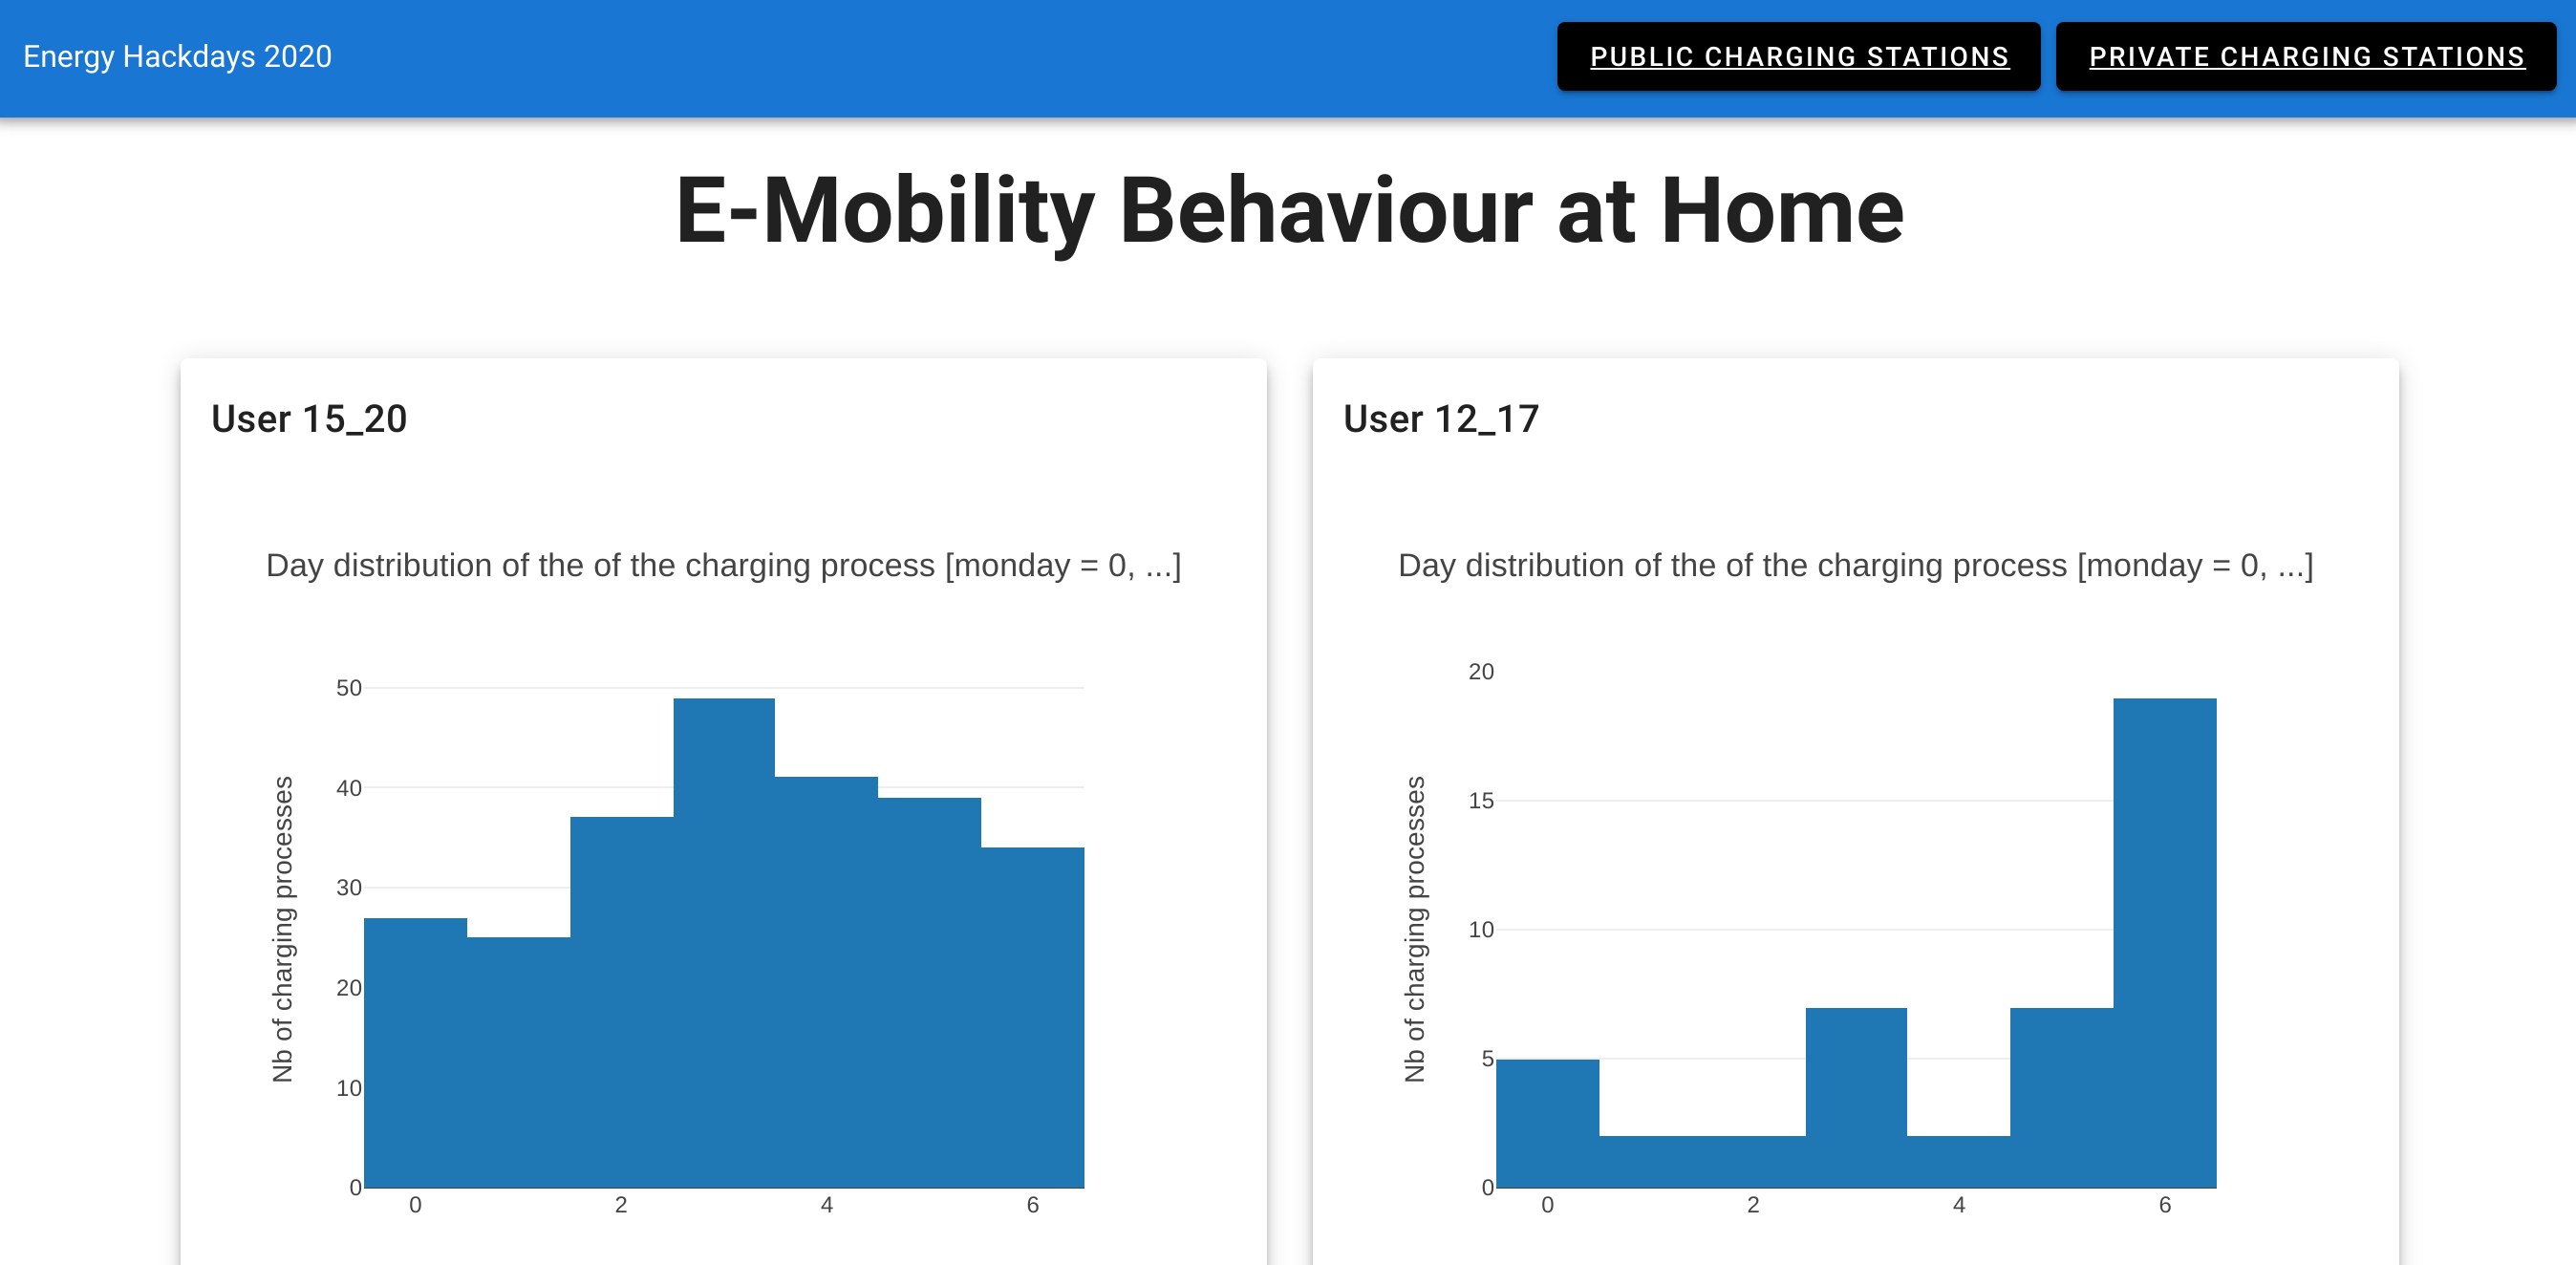
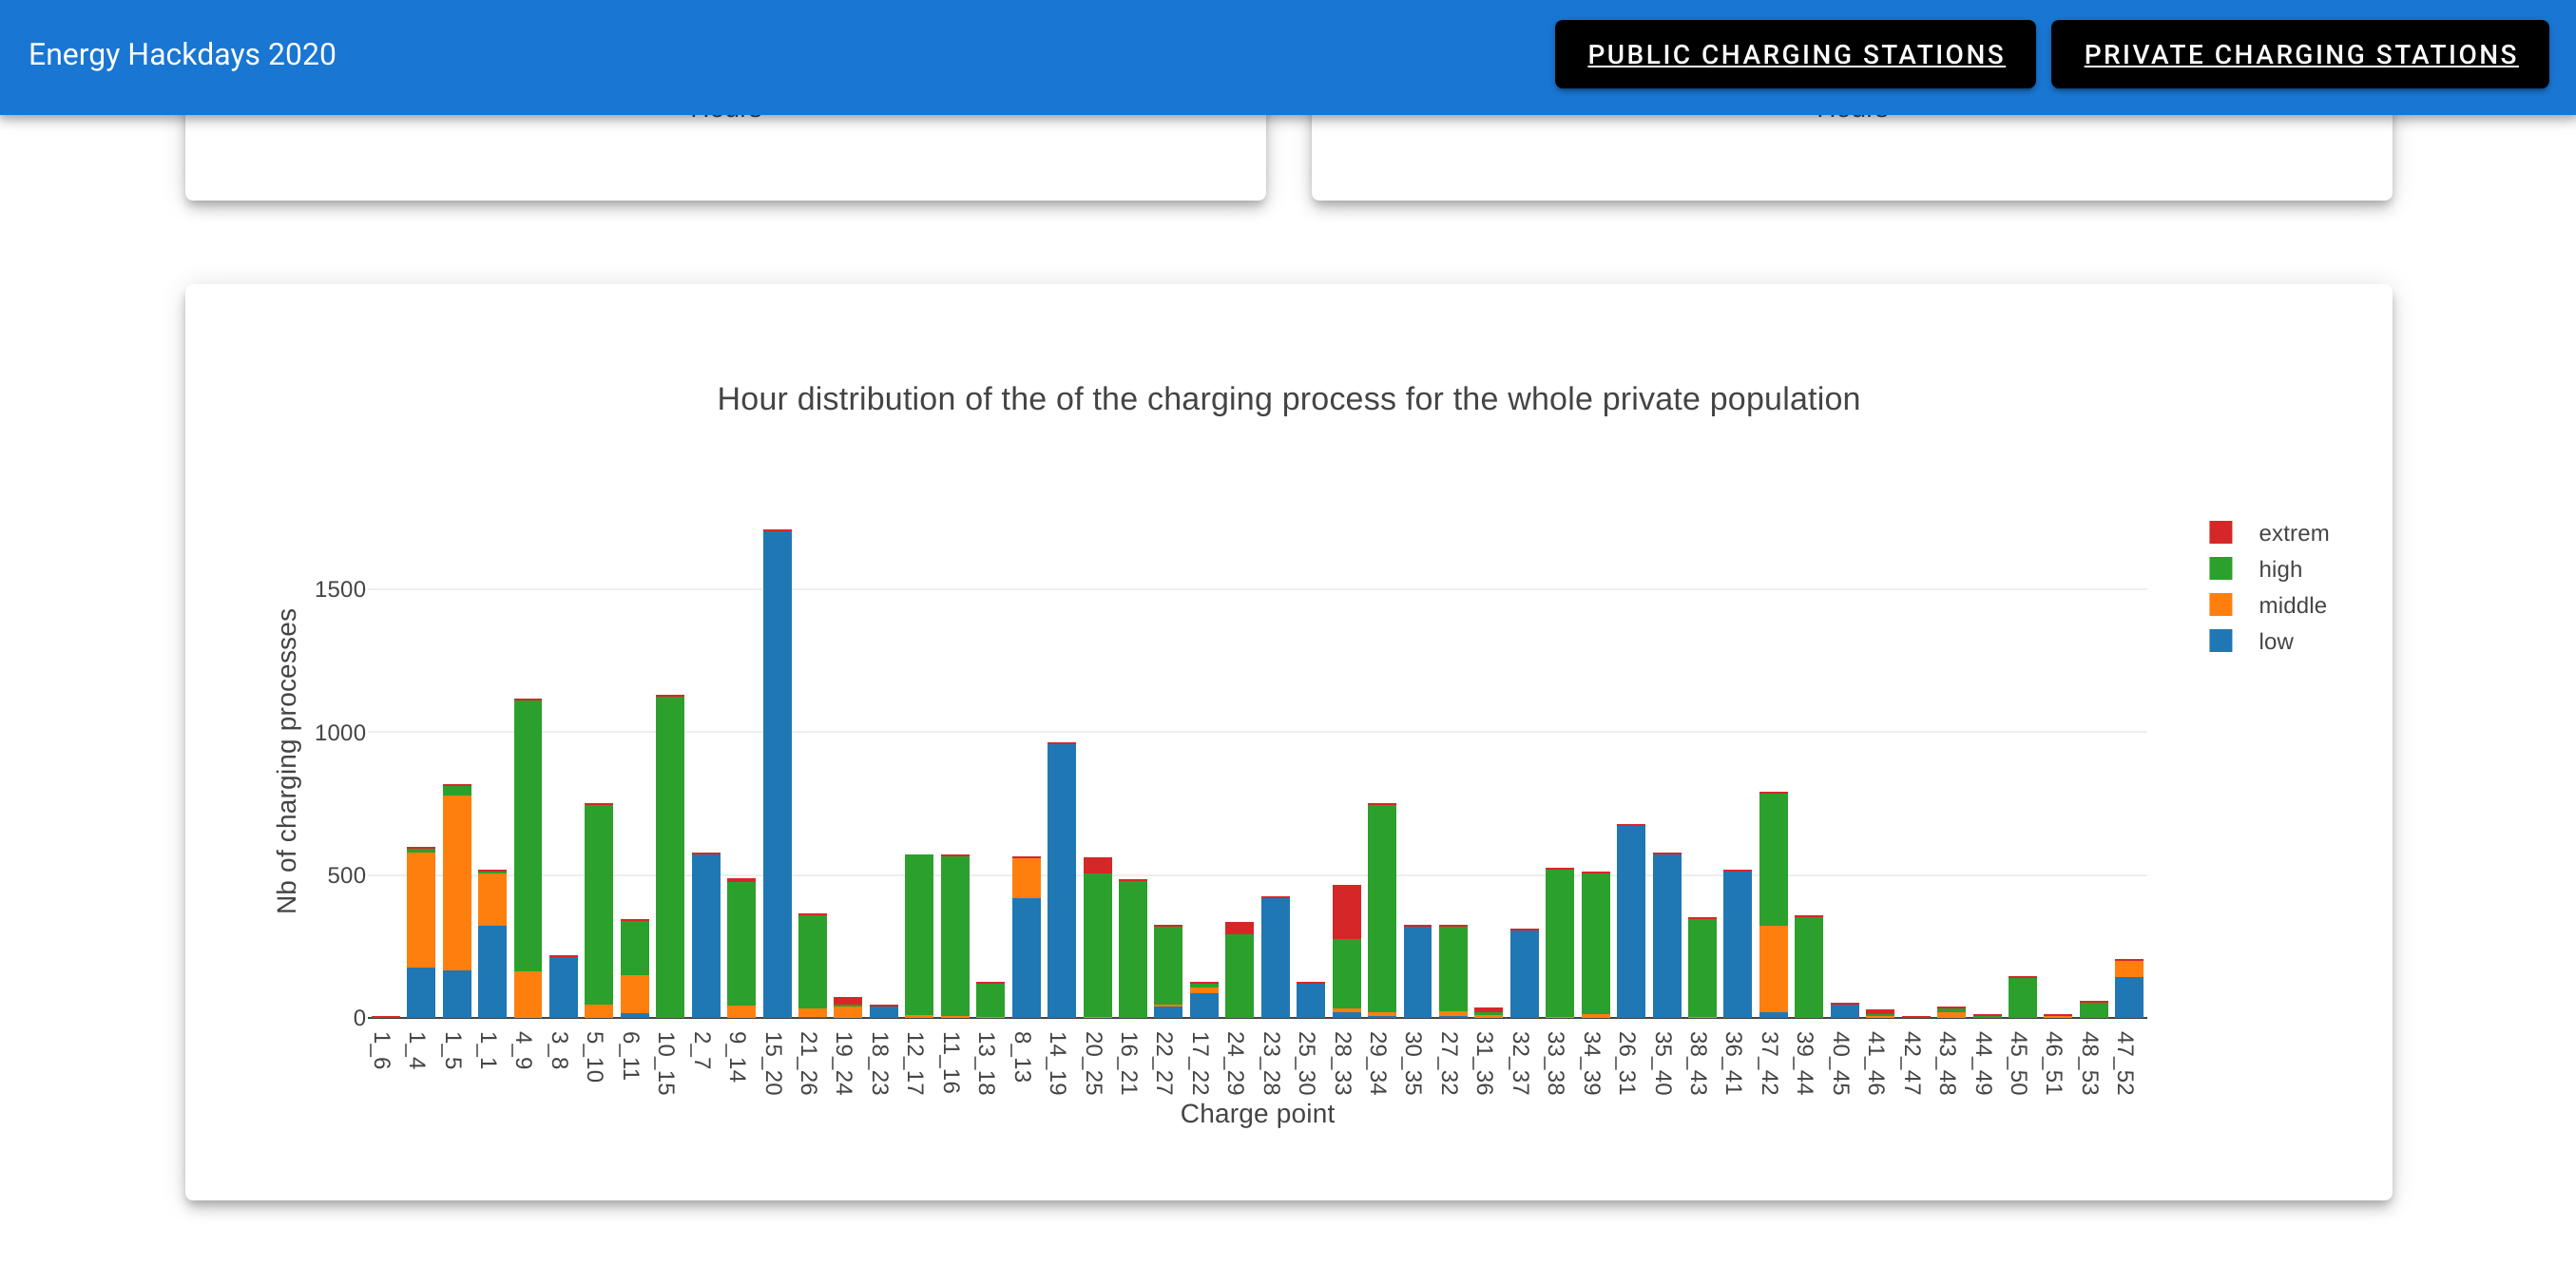
private ev charging station
Different charging patterns of private customers:
- Charging needs
- Hours of charging
- Week days of charging
This provide good hints for a further automated customer segmentation.
comparison of privat & public charging behavior
- different time-profile on weekdays and weekend in public, but not in private
possible next steps
public ev charging station
- occupation forecast for every charging station (hourly based day profile as a new feature for the website www.ich-tanke-strom.ch ) --> for the customers
- clustering with more location-based data (socio-economic, roads, traffic etc.), understanding of different charging patterns --> for the provider
- compare clusters of charging behavior with pv potential and production profiles, possibility of own consumption of charging stations --> for the grid
private ev charging station
- automated customer segmentation based on linked information (building data, socio-economoic data, location) --> for the provider
- cost estimation tool for customer --> for the customer
- prediction of behavior changes for the load-curve --> for the grid
faced challenges
- parsing and structuring provided raw data --> long running tasks
- handling data errors and missing data
things to do
- run everything on database server
- productionalize frontend to shoot queries onto database and parse them to json
Data Engineering
Architecture Overview
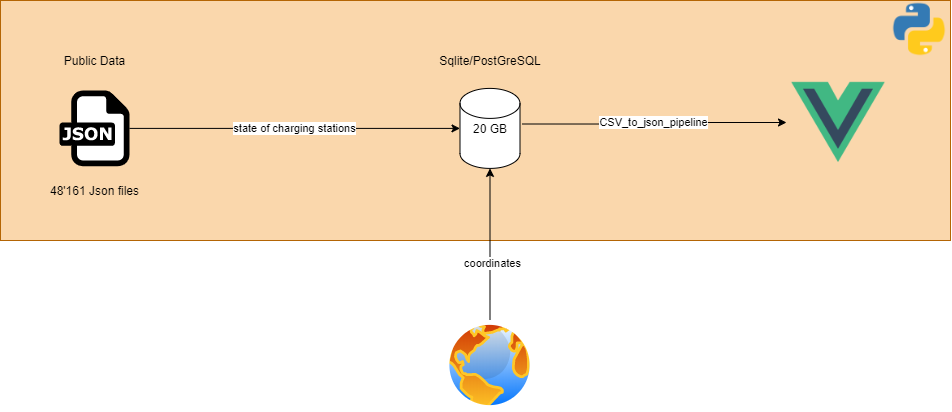 data_engineering_diemo/data_eng_architecture.png
Data Structure of diemo jsons
- EVSEStatuses
- OperatorID
- Operatorname
- EVSEStatusRecord
- EVSEID
- EVSEStatus
Python and SQL part
For parsing the 48'000 json files in 5 minutes resolution for 6 months we used python scripts. We had to implement various exceptions because of empty jsons.
First we tried looping everything into csv, which did not perform as fast as we would like. We then tried Apache Feather as a data transfer format but the data storage speed wasn't the problem. The next try was a sqlite database which works fine and was an okay solution for the hackathon. If the project would go live, we would recommend a database server preferably in the cloud, to get the inital data loading done quick. The dataload still takes over 10 hours and is not very efficient.
SQL Queries
The first query is about getting an overlook over all the EV-Charging points, the different operators.
Visualisation ideas
public ev charging stations
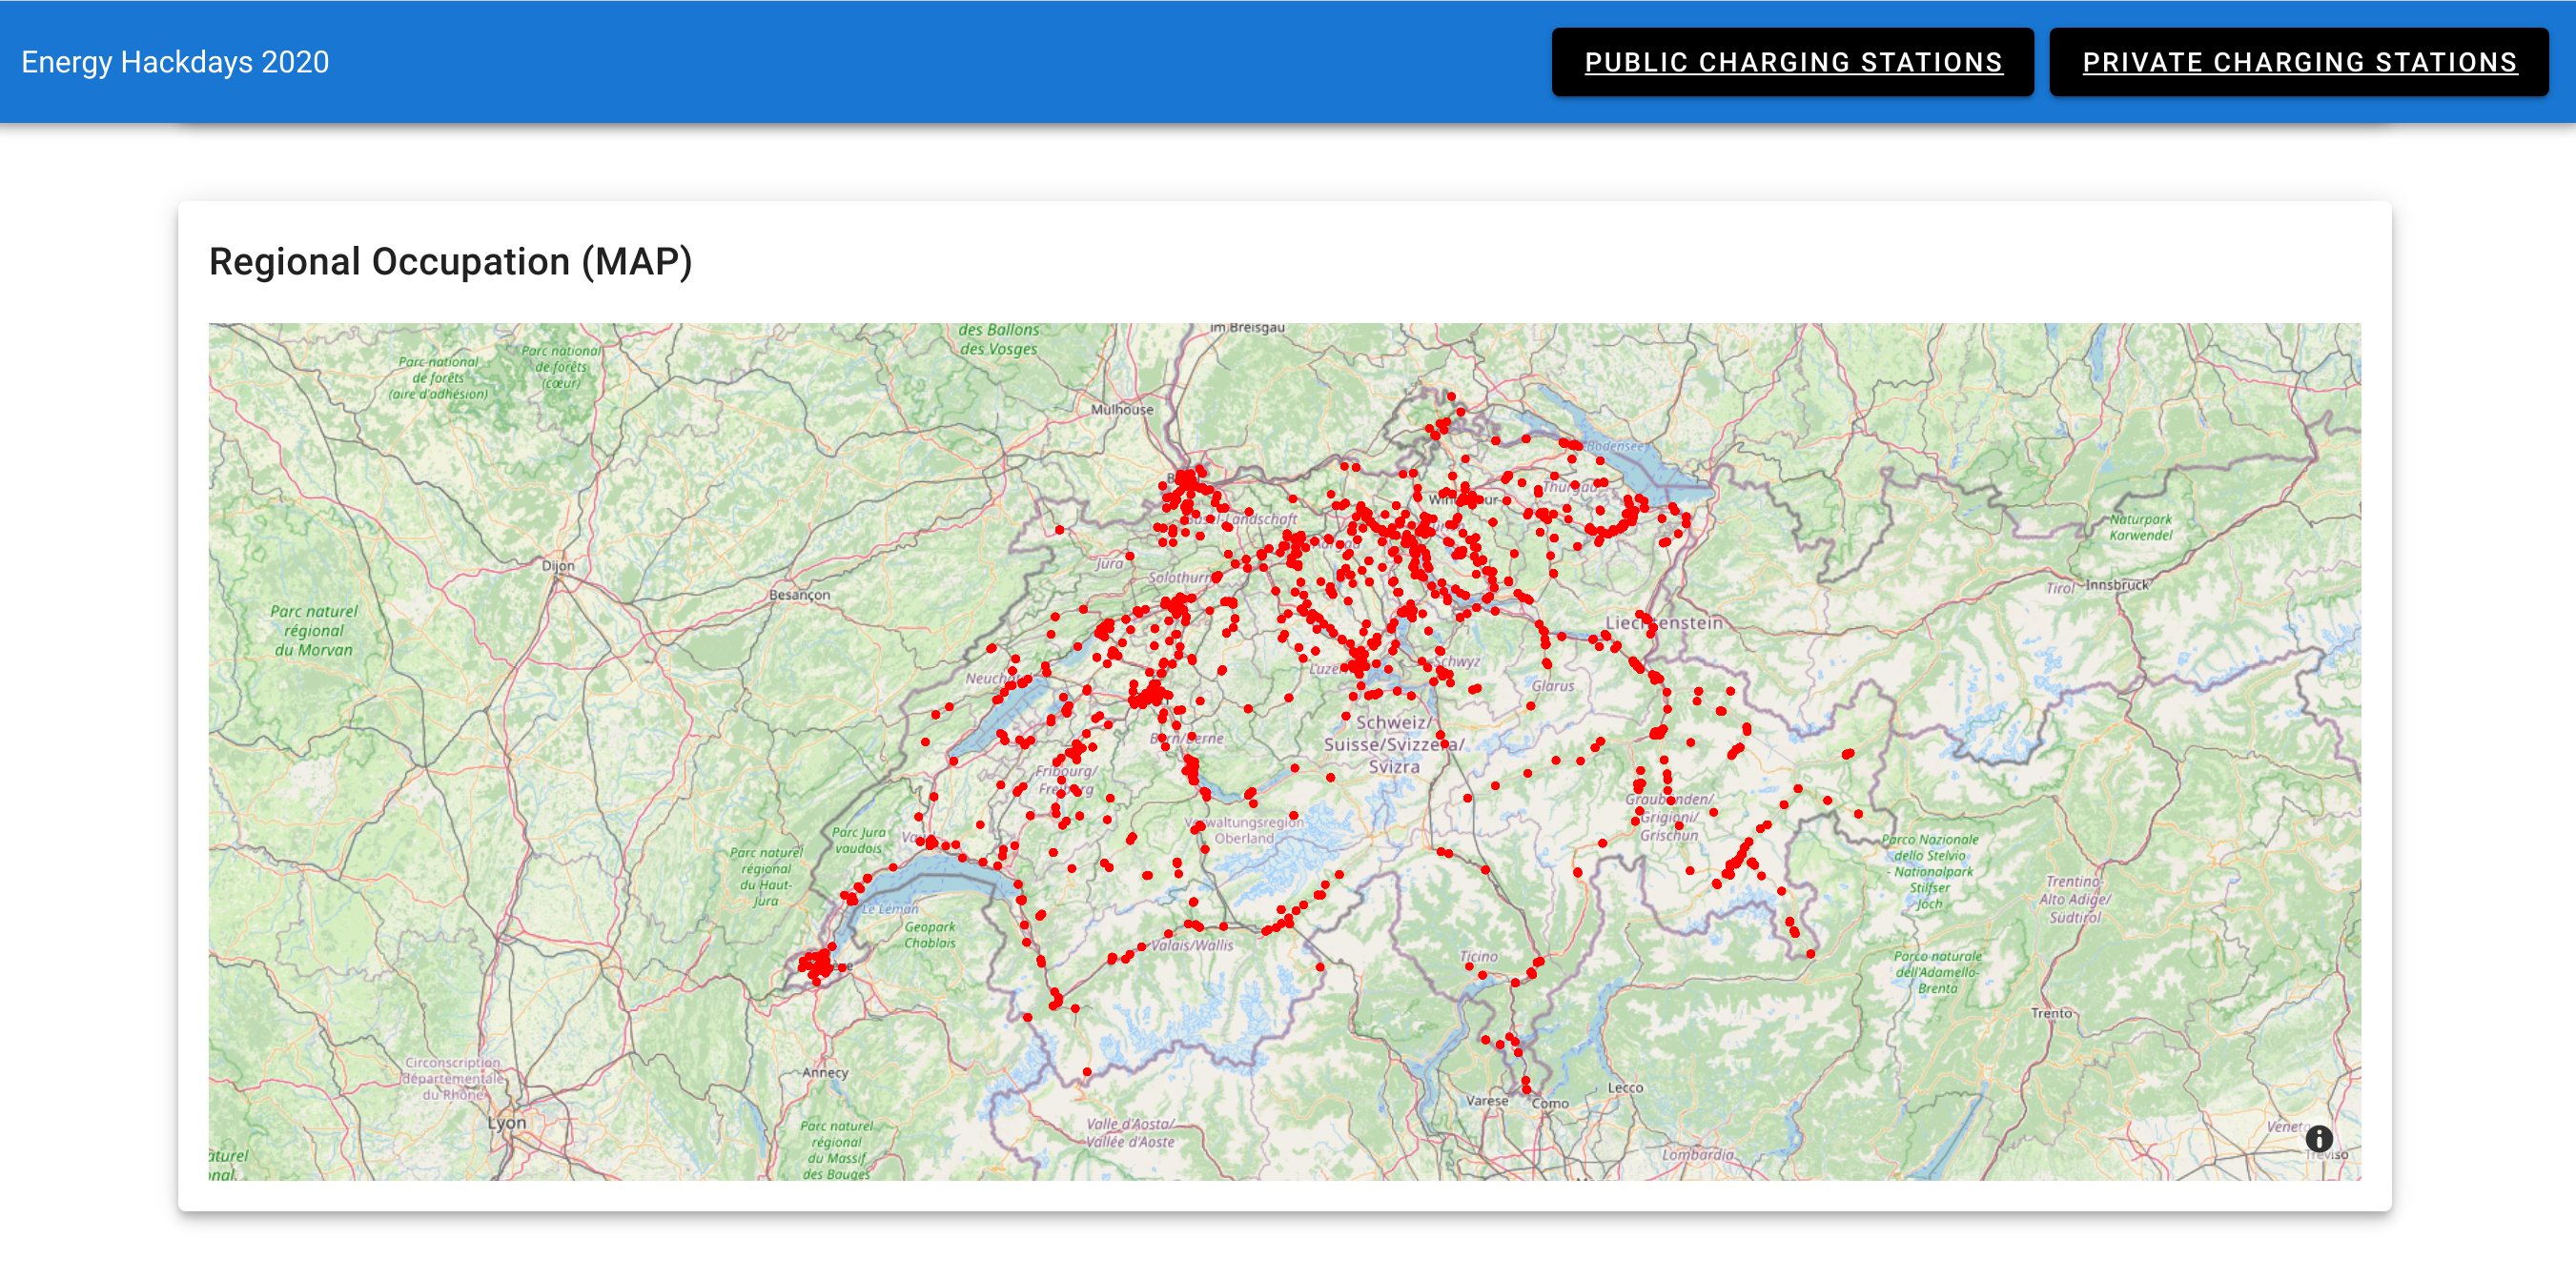
- snapshot for specific time (occupied, available) on a map
- top 3 utilised stations for each canton on a map
- occupation ratio per station on a map
- time-profile clusters --> which stations have the same time-profile
- time-profile in city centers, countryside and touristic regions
- aggregated occupation over time of a day/week for all stations
- occupation over time of a day/week for a selected station
- typically duration of a charging process on a map
Analyses
Charging points utilization
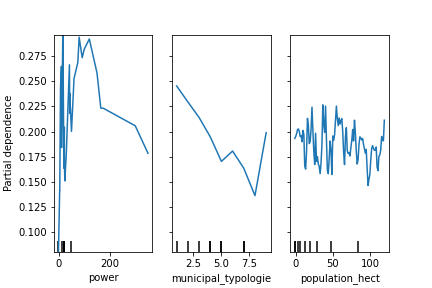
Features analysis:
Legend:
1 | Grosszentren
2 | Nebenzentren der Grosszentren
3 | Gürtel der Grosszentren
4 | Mittelzentren
5 | Gürtel der Mittelzentren
6 | Kleinzentren
7 | Periurbane ländliche Gemeinden
8 | Agrargemeinden
9 | Touristische Gemeinden
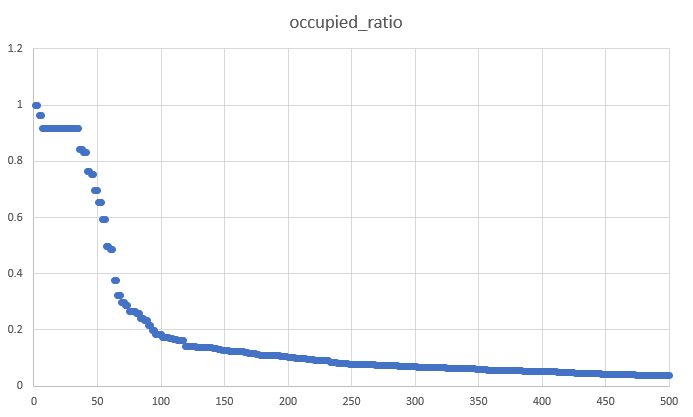
Occupied ration distribution:
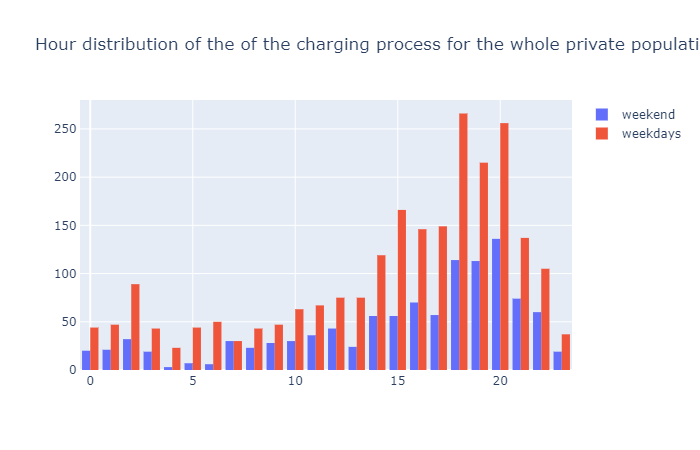
Weekend VS weekdays behaviour for private customers: hourly consumption:
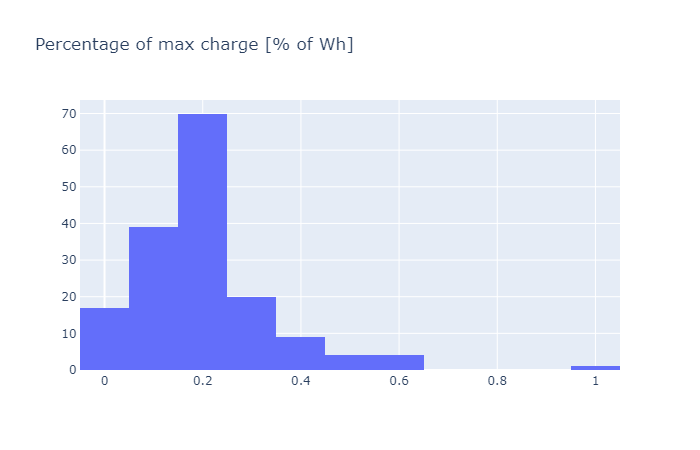
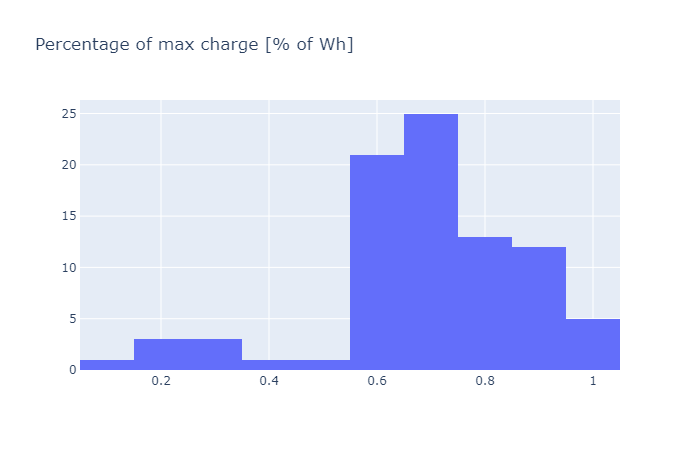
Example of behaviour differences between two private customers: Distribution of the percentage of the whole battery that is charged.
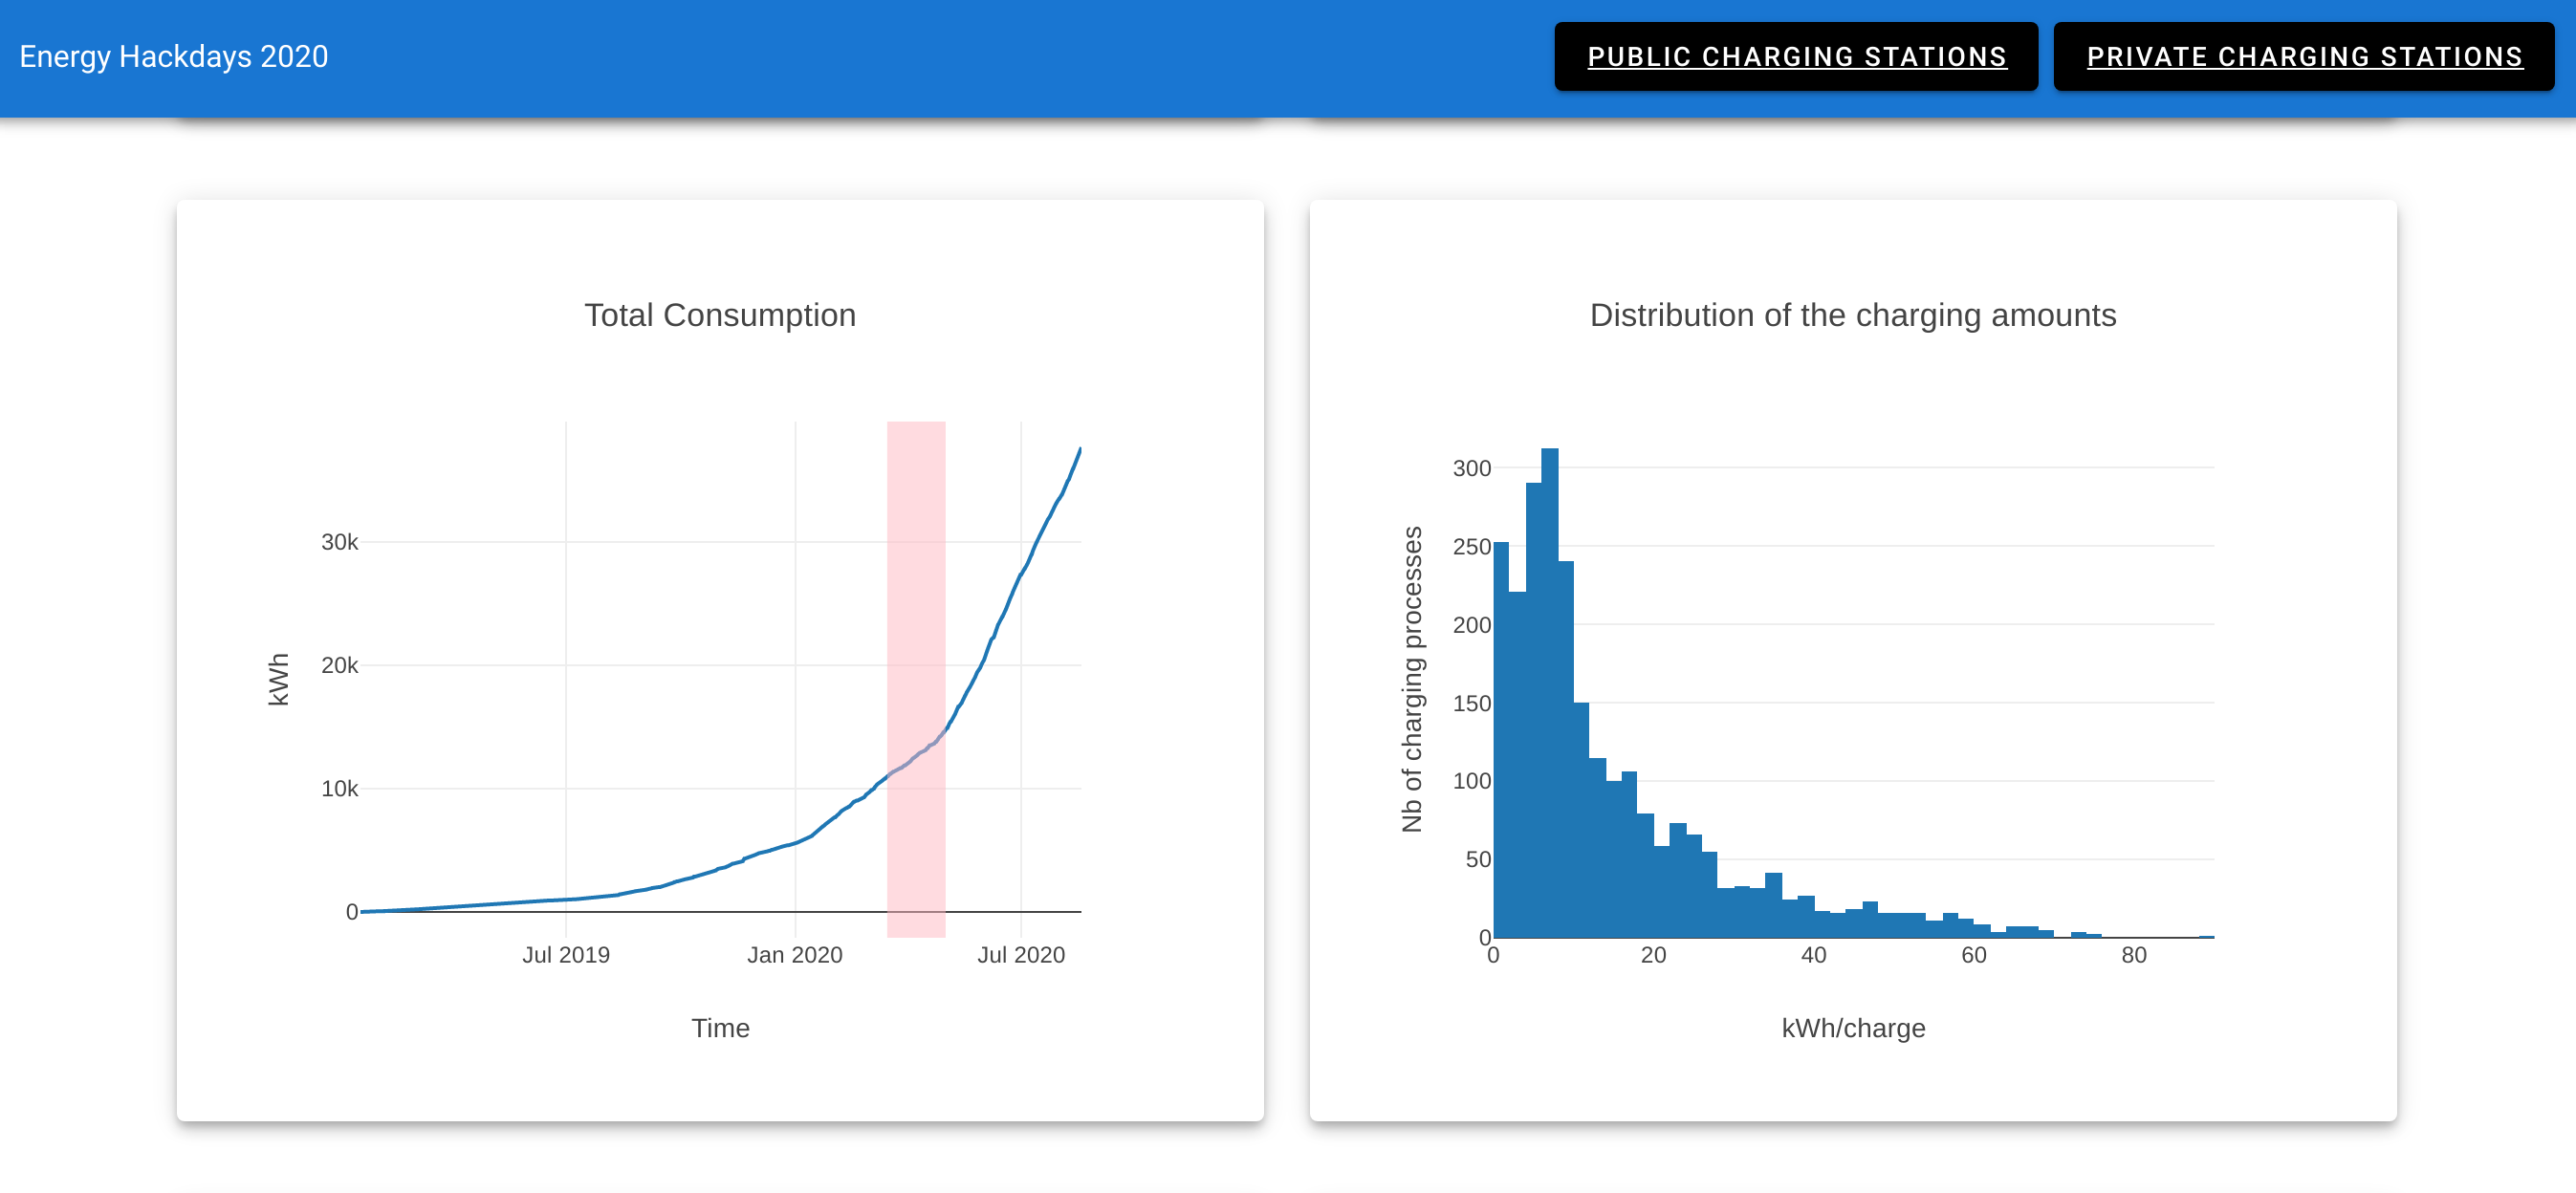
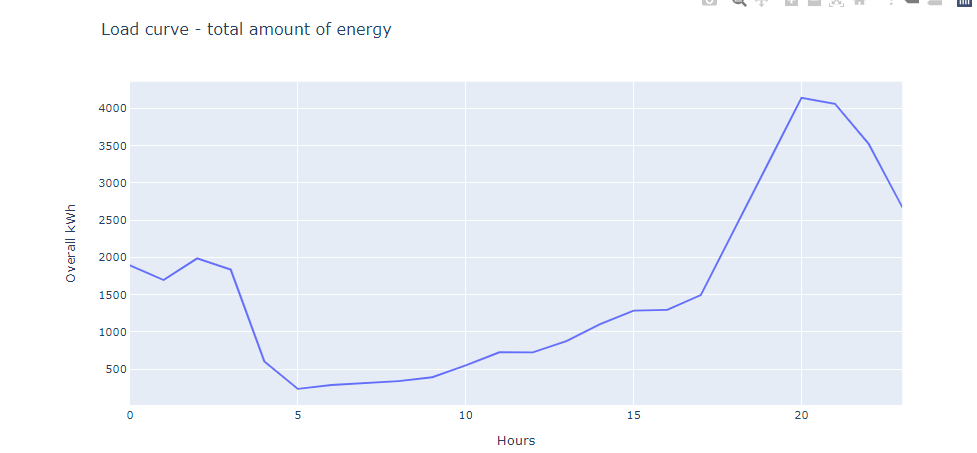
Load curve for private customers:
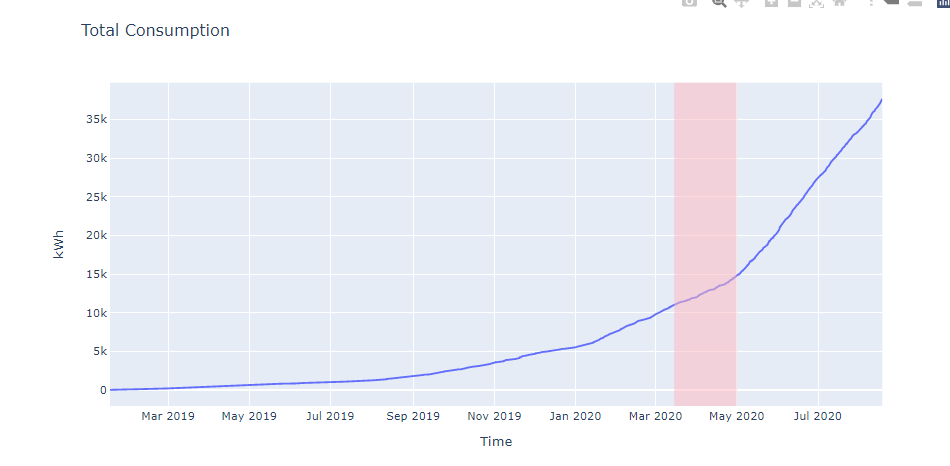
Overall energy consumption by private e-cars. This also show the adoption curve. The red zone corresponds to COVID time.
 The contents of this website, unless otherwise stated, are licensed under a Creative Commons Attribution 4.0 International License.
Previous
Energy Hackdays 2020
Next project