More details about this project, aggregated results and discussion at the School of Data CH forum
This is a project started at the #plurilinguism hackathon, in response to challenge #5 Röstigrabendetektor.
We set out to use the open web and machine learning tools to together explore the dimensions of social geography. What is the röstigraben? It is a kind of meme used to distinguish interests between the two largest language regions in Switzerland. One of those curious things about Switzerland that you learn about in time. Whether or not a röstigraben exists, what character it has gets hotly debated (nzz.ch), typically with statements like this:
"In social and foreign policy, the Romands tend to favour government regulation (influenced by the centralistic political mentality prevailing in France) and an active foreign policy (somewhat discarding Switzerland's neutrality), especially in relation to the European Union." -- https://en.m.wikipedia.org/wiki/Röstigraben

There is also the concept of a Polentagraben with the Romansh/Italian-speaking regions, which could be explored in the same way. For more background on the topic, we suggest reading the Swissinfo article, that links to further analysis and books.
Additional inspirations for this project:
- Parliament Impact Project (opendata.ch)
- What one artist learned about America from 19 million dating profiles (ted.com)
- How Connected Is Your Community to Everywhere Else in America? (nytimes.com)
- Why Journalists Should Talk About Geography (lse.ac.uk)
- How East and West think in profoundly different ways (bcc.com)
- Wikinews on Newsworthiness (wikinews.org)
The hack
The Jupyter notebook we wrote at the event, coded in the Python programming language, explores interaction with the TextRazor API which performs language detection and entity extraction on free-form text. They even have support for classifiers from the IPTC NewsCodes ontology, support semantic metadata out of the box, etc. It's a pretty cool API, easy to get started with, though not completely open (and there are open alternatives to explore as well), and has a fee starting from 500 requests per day.
The output provides Freebase identifiers, which are easy to use to filter the list to people, locations and organizations, and Wikidata identifiers (such as Q214086 for Suisse Romande). We expand these through the Wikidata open API to obtain geographic coordinates of headquarters or birthplaces. Through a simple calculation at the end we obtain a score indicating how far röstigrabenised the article is.
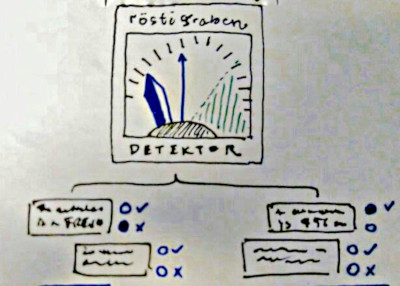
After providing a link to the article, the tool (through a Web interface, Twitter/chat bot, etc.), runs and provides visual results of the analysis. Additionally the user should be able to see the specific entities in the text that the score is based on, and decide to ignore them in the calculation - to filter out false positives - or even add their own opinion.
The end result should look something like this sketch:

Ultimately we should be able to crowdsource responses about a variety of news sources, and construct a map of their polarisation towards or against a cultural bias.
Scroll down to see our hackathon project in action.
Note
The current version uses the old fashioned Wikidata API service instead of Sparql queries, and could be improved using a query like this one possibly linked to Q214086 (Suisse Romande). An example project that uses this is wiki-climate.
We also considered expanding the reach of our classifications using a tool for Social Network analysis (see O'Reilly, socnetv).
Team
- Celine Zund
- Karlen Kathrin
- Oleg Lavrovsky
Previous
Mehrsprachigkeit - Plurilinguisme - Plurilinguismo - Plurilinguitad
Next project


