
Report
💡 Active projects and challenges as of 21.07.2026 23:09.
Hide text CSV Data Package Print
10 - 2000-Watt-Site - Reduction of energy consumption
🌳🏡🌳
Summary
Why?
The Grossmatte in Littau and the Schweighof in Kriens are newly established resident areas. Both projects seek to reach the goals of the 2000-Watt-Society. There is a gap between the site owners and the resident’s interests regarding the achievement of the 2000-Watt goals. The main question is, how do site owners encourage residents to alter their lifestyles to be more in line with the 2000-Watt goals? Also, there is a lack of identification of the residents with their neighborhood.
What?
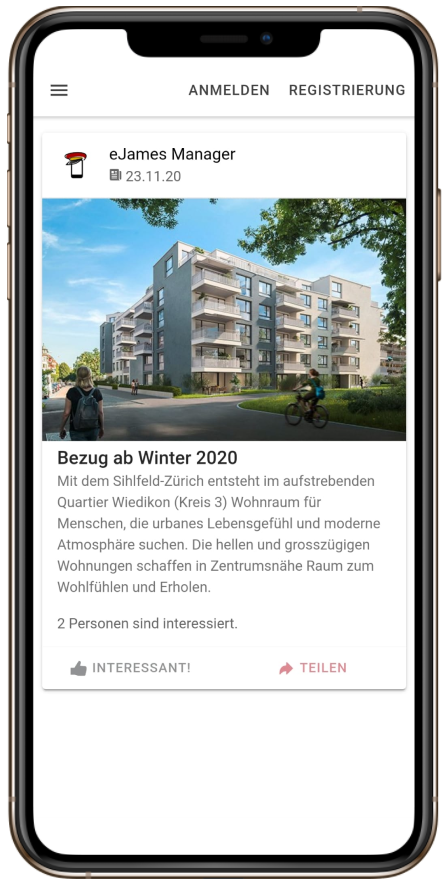
Currently, the residents can use an app, which displays all the information about their apartment’s consumption. However, there is no possibility to compare their stats with other residents. Hence, they don’t know whether their consumption is high or low in relation to other apartments. We therefore suggest, to put this information into context by introducing a comparison method which figures as an information tool as well as an incentive system.
How?
Our idea is to introduce a ranking, which compares the individual consumption to the neighbor’s consumptions. This ranking could be either included into the currently used app or displayed on screens in the hallways. Based on this ranking, a recommender system could be implemented, which informs the user about possible ways of reducing their consumption and improving their ranking. Finally, for example every year, the best couple of apartments could be offered a benefit. Possible are financial, physical or digital benefits. We recommend including all the services available on the 2000-Watt site when defining the benefits. For example, coupons for stores and coffee shops might foster the social life and the identification of the residents with the site. Apart from stores and coffee shops, coupons for the car sharing service might help to introduce people to the car sharing concept and reduce “usage barriers”.
Process and Methods
Findings & Obstacles
In order to implement an effective incentive system, the comparability of the consumption data is inevitable. The apartments differ in size and in the count of inhabitants, which might distort the ranking in an unfair way. As well as the algorithm, the incentive is a crucial part of the system. The ETH Zürich, together with the EWZ, conducted a research project, which studied the effectiveness of different forms of incentives on reducing energy consumption.
Bonusmodelle für energieeffiziente Haushalte - EWZPrototype
Test our two different prototyps and click on the phone or on the desktop image.

Outlook
First, the project would have to be evaluated and approved by the investors. Then a team of experts and developers would have to be assembled to continue the project. For this purpose, a data pool with all necessary data would have to be set up, which could then be used for the calculations. To continue this project, we would recommend that the project team would exchange information with the EWZ and thus benefit from their experience.
Data & Informations:
2000-Watt-Site Schweighof, Kriens2000-Watt-Site Grossmatte, Littau
Catalogue of criteria
106: Quality of Life in Lucerne
What can the city administration of Lucerne do to enhance the quality of life for its residents?
Challenge Definition
During a student project, the city administration of Lucerne invited city residents to answer an online questionnaire about their perceived quality of life. The result of this online questionnaire is a rich set of data from 630 participants.
Already during the student-project, many interesting insights could be read from the data. Nevertheless, we would like to dig a little deeper in this set of data.
- What coherences can be found?
- How do the demographics influence the different aspects of life that are connected to quality of life?
- What is your advice to the city administration?
The city administration is happy to use the results of this challenge to further improve quality of life in the city of Lucerne.
Data:
- Answers of the online questionnaire (raw data, unpublished)
- Results of the student project
- Results of the (official) population survey 2019: www.lustat.ch/daten?id=26999
Contact: nadja.vonballmoos AT stadtluzern.ch

Project
Our Approach

To get to our overall goals we have different approaches.
- We build clusters to group the data.
- We look at correlations and use machine learning models (LM, Decision Tree …) to see which factors impact the overall quality of life the most.
- We use text analysis to interpret the comment sections of the online questionnaire.
- We search for specific demographic characteristics with a high or low quality of life to get further insights.
Main Results and Insights
Disclaimer: The data in this survey is not representative of the whole population of Lucerne
Clustering
By appling clustering on the whole data set, we could find 5 groups that differ in various aspects of their quality perception.
 Correlation Matrix
The Correlation Matrix helps us to understand, which variables correlate to a certain degree with the response variable "Lebensqualität Allg."
Correlation Matrix
The Correlation Matrix helps us to understand, which variables correlate to a certain degree with the response variable "Lebensqualität Allg."
 Decisicion Trees
The Decision Tree gives us a idea, which variables could be relevant for the splits.
Decisicion Trees
The Decision Tree gives us a idea, which variables could be relevant for the splits.
 Closer Look to City Participation
With help of logistic regression and classification trees we found that especially the variables "Zuzug" (time since moving in to Lucerne) and "Bildung" (eduction) have an influence on the city participation and engagement.
Closer Look to City Participation
With help of logistic regression and classification trees we found that especially the variables "Zuzug" (time since moving in to Lucerne) and "Bildung" (eduction) have an influence on the city participation and engagement.
 Text analysis
A text analysis of the answers to the question "Wovon wünschen Sie sich mehr?" led to the following word cloud.
Text analysis
A text analysis of the answers to the question "Wovon wünschen Sie sich mehr?" led to the following word cloud.
 Next steps
- Further focus to more specific questions (based of the new insights)
- Further analysis with more survey data
- Build a framework including the most common used methods
106: HackdaysLucerne - Quality of Life in Lucerne
What can the city administration of Lucerne do to enhance the quality of life for its residents?
Challenge Definition
During a student project, the city administration of Lucerne invited city residents to answer an online questionnaire about their perceived quality of life. The result of this online questionnaire is a rich set of data from 630 participants.
Already during the student-project, many interesting insights could be read from the data. Nevertheless, we would like to dig a little deeper in this set of data.
Ideas:
What coherences can be found? How do the demographics influence the different aspects of life that are connected to quality of life? What is your advice to the city administration? The city administration is happy to use the results of this challenge to further improve quality of life in the city of Lucerne.
Data:
Answers of the online questionnaire (raw data, unpublished) Results of the student project Results of the (official) population survey 2019: www.lustat.ch/daten?id=26999
Contact administration of Lucerne: nadja.vonballmoos@stadtluzern.ch
Git-Hub Documentation:
- README.md
- cleaned_data.csv (anonymised)
- HackdaysLucerne-LifeQualityAnalysis_Arbenz_Koelliker_Wenger (Correlation Matrix & Decision Tree)
- CityEngagement_vs_Demographics
- Comments-Analysis-StadtLuzern.ows (Word-Cloud)
- clustering_personas.html
- Analyse_Personas.xlsx
11 - Reduce car rides at traffic peak hours
How to cope with traffic on the Nidfeld 2000-Watt Site in Kriens (LU)
Topic:
On the Nidfeld site in Kriens, a new neighborhood with apartments and commercial space is currently under construction. To avoid overloading the traffic situation in the area during peak hours, there is a given requirement (by the authorities) on how many cars are allowed to enter and leave the site between 17:00 CEST / 5 PM and 18:00 CEST / 6 PM.The "Fahrtenmodell" available to the site developer Losinger Marazzi AG estimates that the maximum of 200 entrances and exits will be exceeded once the new site is in use.
Challenge:
Use the "Fahrtenmodell" to gain ideas about reducing the number of car rides during the peak hour. Review / test your solutions based on the "Fahrtenmodell".Possible Solutions:
Losinger Marazzi's current plan is to slow down the exit barrier to limit the number of exits temporarily. However, there must be a better solution than this. For example, there might be ways to create incentives for residents, workers, and customers to bypass the peak hour or use public transport, bicycles, or car sharing. You are free to think out of the box and come up with solutions that reduce the number of car rides to the allowed maximum.Data & Tools:
- Further information on the Nidfeld Site and challenge (github link below)
- Development plan Nidfeld | Regulations (in particular access and mobility in chapter 6)(github link below)
- Development plan Nidfeld | Site plan (github link below)
- Geo portal Lucerne | Public transport stops in Kriens
- Geo portal Lucerne | Zone map Lucerne
- LUSTAT Statistics Canton Lucerne
- Federal Office for Statistics | Mobility & Transport Data
- Open data platform mobility Switzerland
- Google Maps
- Open Street Map
- GitHub
First update:
Initially, we have evaluated different possible solutions to reduce traffic during rush hours caused by residents. Still, on the other hand, we are also questioning the Mobilitätsbüro's calculation, i.e., Google shows that Prodega customers peak around midday-2pm, which would imply that the 10% share of DWV in the peak hours 5pm-6pm seems overly optimistic. We identified two possible stakeholder groups where significant improvements can be made: 1. Residents 2. Prodega customersResult:
We evaluated possible solutions to reduce traffic during rush hours caused by the key stakeholders: residents and Prodega customers. Although a third group - employees of companies located in the area - contributes to the traffic situation, we focused on the first two groups. Measures for residents and Prodega customers seem to be more feasible than for employees. Before coming up with ideas and evaluating them, we questioned the data that was provided to us. When comparing the numbers of Prodega visitors with the "Popular Times" section for Prodega Kriens on Google, we detected that the number of customers peaked around midday-2pm. This implies that the Mobilitätsbüro assumption that 10% of DWV is from 5pm to 6pm seems overly optimistic.
Key Stakeholders:
- Residents
- Prodega customers
## Process:
In the beginning, we sat together to brainstorm. The goal was to get a wide set of ideas prioritized and evaluated in detail. This resulted in the following mindmap containing ideas for residents and Prodega customers:

### Residents: We believe that financial benefits or other incentives can influence human behavior. Therefore we came up with ideas for residents to not use their cars during rush hour. The following options are among them:
- Carpooling service via App
- Partially subsidized car-sharing services
- Signaling: Control of traffic flow (i.e., sending outgoing traffic in one direction only)
- Reduced or even free public transport tickets
- Mobility Car Sharing promotion, i.e., free annual subscription
- Variable monthly parking fee. I.e., discounts if no exits in peak hours are registered. This may follow a staggered approach, e.g., no departures will give the highest discount, whereas up to 10 exits per month will yield a slightly reduced discount.
- Free delivery services for residents: We believe a certain share of exits may be attributed to grocery shopping.
- commercial stores on the ground floor: evaluate supermarket
- Make the way between the living area and nearest train station more attractive by offering e-mobility solutions like e-scooters or enuu vehicles, attractive pricing necessary.
Prodega:
- Partially subsidized delivery service for Restaurants
- Time-dependent discounts. I.e., time the discounts to only be valid during non-peak hours. Prodega's cooperation may be awarded a rent deduction.
- Promote online shopping services.
- Promote combined pickup for multiple customers
- Time-dependent parking fee:
- Free of charge from 10am-3pm
- From 4-7pm pm e.g. 5 francs/15minutes.

Evaluation of Main Ideas
Variable monthly parking fee for residents and employees
Implement a bonus system for individuals that rent a private parking spot. The default rent is set to above average in the beginning of the month. Residents can reduce their rent by not exiting the area during the peak time slot 5-6 pm. If a certain number of exits or entries during the peak time is not surpassed, the rental price will drop significantly. The App designed for the area could display the savings for each resident.
| Area | Assessment |
|---|---|
| Effect | Lowers traffic during peak time. |
| Feasibility | Altering the rental price does not require any costly steps. Registration of exit and entrance can be measured either by sensors on the parking spot or by registration of the license plate number at the exit/entrance location. |
| Financing | Above average rental compensates the bonus. |
| Acceptance | As the measure is designed as a bonus and not as a malus system, we assume wide acceptance. |
| Risk | Above average (upfront) prices for parking spots may have a negative impact on attractivity of living area |
Time-dependent discounts for Prodega customers
Identify customers that regularly shop during peak times at Prodega. Analyze their shopping behavior and offer time-dependent personal discounts (i.e., use Supercard data). For example: "10% on mayonnaise before 5pm or after 6 pm."
| Area | Assessment |
|---|---|
| Effect | Altering preferred shopping time for customers |
| Feasibility | Identification of products and customers with the biggest impact is feasible under the condition that the data collection occurs through loyalty cards. Difficult to convince Prodega to participate. |
| Financing | Prodega discount could be financed through a reduction of rent. |
| Acceptance | As the measure is designed as a bonus and not as a malus system we assume wide acceptance. Acceptance of Prodega is questionable. |
| Risk | Prodega is not willing to participate. Cost of discount financing may be too high. |
Reduced or free public transport tickets & Subsidized Mobility Car Sharing for residents
Reduced public transport cost for residents may lower car usage. Subsidizing the annual subscription of Mobility Car Sharing for the residents and providing on-premise Mobility Cars might get people not to want to own a car.
| Area | Assessment |
|---|---|
| Effect | Shift from car to public transport or car sharing results in less traffic. |
| Feasibility | Measure is easily implementable under the condition that financing is solved. |
| Financing | Finance through higher parking spot price or include the discount in the rent. |
| Acceptance | Depends on financing. Public transport discount needs to be conveyed as an extra service. |
| Risk | Strong dependence on the quality of public transport. Public transport discount may not lead to usage. |
E-Mobility solutions between living area and nearest/most important train stations
In order to increase usage of public transport the transfer time from the living area to the nearest train station is crucial. To shorten the transfer time, the availability of e-mobility vehicles like e-scooters, e-bikes or e-cars (for example, Enuu) could be ensured. The provider may implement a specific subscription model for residents.
| Area | Assessment |
|---|---|
| Effect | Attractivity of public transport increases. Shift from car to public transport results in less traffic. |
| Feasibility | Feasible if e-mobility providers are willing to collaborate. |
| Financing | Fixed cost of loading stations may be financed by the e-mobility providers. |
| Acceptance | Additional mobility offer does not have any negative impact on residents and should be widely accepted. |
| Risk | Usage of e-mobility depends on the weather situation. Constant availability of e-vehicles is difficult to guarantee. |
Next Steps:
Before proceeding with further analysis, we strongly recommend to the challenge owner to verify the data provided by the "Mobilitätsbüro" as we can not assure its validity. LUSTAT and Astra may be the right institutions to get in touch with. Unfortunately, we could not communicate with them as we did not get any responses either by phone or by email.
We spent a fair amount of time trying to model the traffic flow using the open-source and state-of-the-art urban mobility modeling software "SUMO". We deem the software's capability as quite significant and thus recommend investing more time in modeling the traffic flow surrounding the area to trial various ideas. We are attaching the developed modeling environment in the following ZIP file: Link
9: 360° Stakeholderfeedback
Stakeholderanalysis dashboard to mitigate risks in building projects.
Development of a tool for the 360° analysis of stakeholder interests and identification of key opinion leaders (KOLs)
WHY
For large projects with high level of investments such as building projects delays and changes during the planning stages are a risk. One of the measurements to mitigate this is to closely manage the different stakeholders to identify hidden requirements and problems as early as possible.IVO Innenentwicklung AG advises and supports municipalities and cities in the transformation of urban spaces. In order for IVO to meet the interests of as many stakeholders as possible, their needs and requirements are assessed by means of personal interviews and online surveys, which serves as a good data basis but does not provide a quick overview on status, issues and stakeholder group.
BUSINESS VALUE
Better understanding of stakeholder and community needs Support in opinion forming with a tailor-made communication strategy by identifying KOLs Reputation building and expectation management through insights gained from stakeholder management Efficient and structured approach to data analysisWHAT
We are addressing this problem by providing a concise but informative dashboard containing grouping, qualification and prioritization of the stakeholders in order to make more of the available data and provide users with a fast overview by project.HOW
Aggregation multiple data sources such as data from online surveys (MS Excel), transcripts of personal interviews (MS Word) by NLP sentiment-analysis / part-of-speech-tagging, network analysis, dependency detection and interactive dashboards.Data sources:
- Data from online surveys (MS Excel)
- Transcripts of personal interviews (MS Word)
- external data sources as required
Aapproaches:
- NLP: Sentiment-Analysis, Topic Modelling
- Anomaly detection, dependency detection
- Interactive Dashboards
Technology:
- Python, R
- IBM Watson
- Google NLP API
Repository Link:
Google ColabNEXT
- Presentation to and discussion with IVO Innenentwicklung AG
- Improve Data Collection and set up proper ETL-process
- User Testings with Dashboard - Initiate Improvement Feedback Cycles
- Launch MVP
Readme
Hackathon
This jupyter notebook was created for the "Open Data Hackdays - Shape My City" event: https://opendata.ch/projects/hslu_shape-my-city-2020/
Installation
If downloaded locally, install all required modules & create folder structure.
|--root
    |---Data
        |---interview_n.docx
Usage
Provide your own API key and url when calling IBM Watson in Cell [15].
Data
Put Interviews as .docx files in folder "Data". The analysed csv data will be saved to the current working directory.
CODE
We have written selfdocumenting code, which you can access directly on Google Colab:
DASHBOARD
The interactive Dashboard can be found under the following link: