Regional Energy Information in High Resolution
Collecting, analyzing and visualizing energy policy data from Swiss communities
National energy policy goals are known and monitored, but how is the progress of the Swiss energy transition on regional level?
Working on our challenges will contributing to the current, highly relevant discussion on security of energy supply in Switzerland. You will support us to develop cutting-edge energy policy design.
Step 1: Web scraping energy policy goals
Find and gather information about energy policy goals and activities of municipalities. Identify ambitious and less ambitious municipalities Optional: Cluster municipalities that follow same/close goals and benchmark
Step 2: regionalize renewable energy production
How much production in Swiss municipalities? Data wrangling and fusion
🧑🏽🏫 GeoImpact/BfE Digital Office
Project Team
Who has which skills and is in which team - policy (P), data (D), scraping (S)

- Emilie Boillat
- Guiseppe Caponetto
- Peter Janes («Piet»)
- Baptiste Jordan
- Manuel Meyer
- Lukas Oberholzer
- Matthias Pauli
- Peter Robineau
- Jan-Philipp Sasse
- Alexander Thommen
- Lucas Tochtermann
- Thilo Weber

Team 1 - Policy and Data
Which energy policy keywords and categories are relevant?
Step 1 - Brainstorming Keywords

Step 2 - Structuring Keywords
Clustering brainstorming results mind map and converting to a structured table

Team 2 - Web Scraping
Finding energy policy information on Swiss municipality websites.
## Step 1 - Manual Samples
Manually retrieving text data from few sample municipalities

Step 2 - Building a Scraper
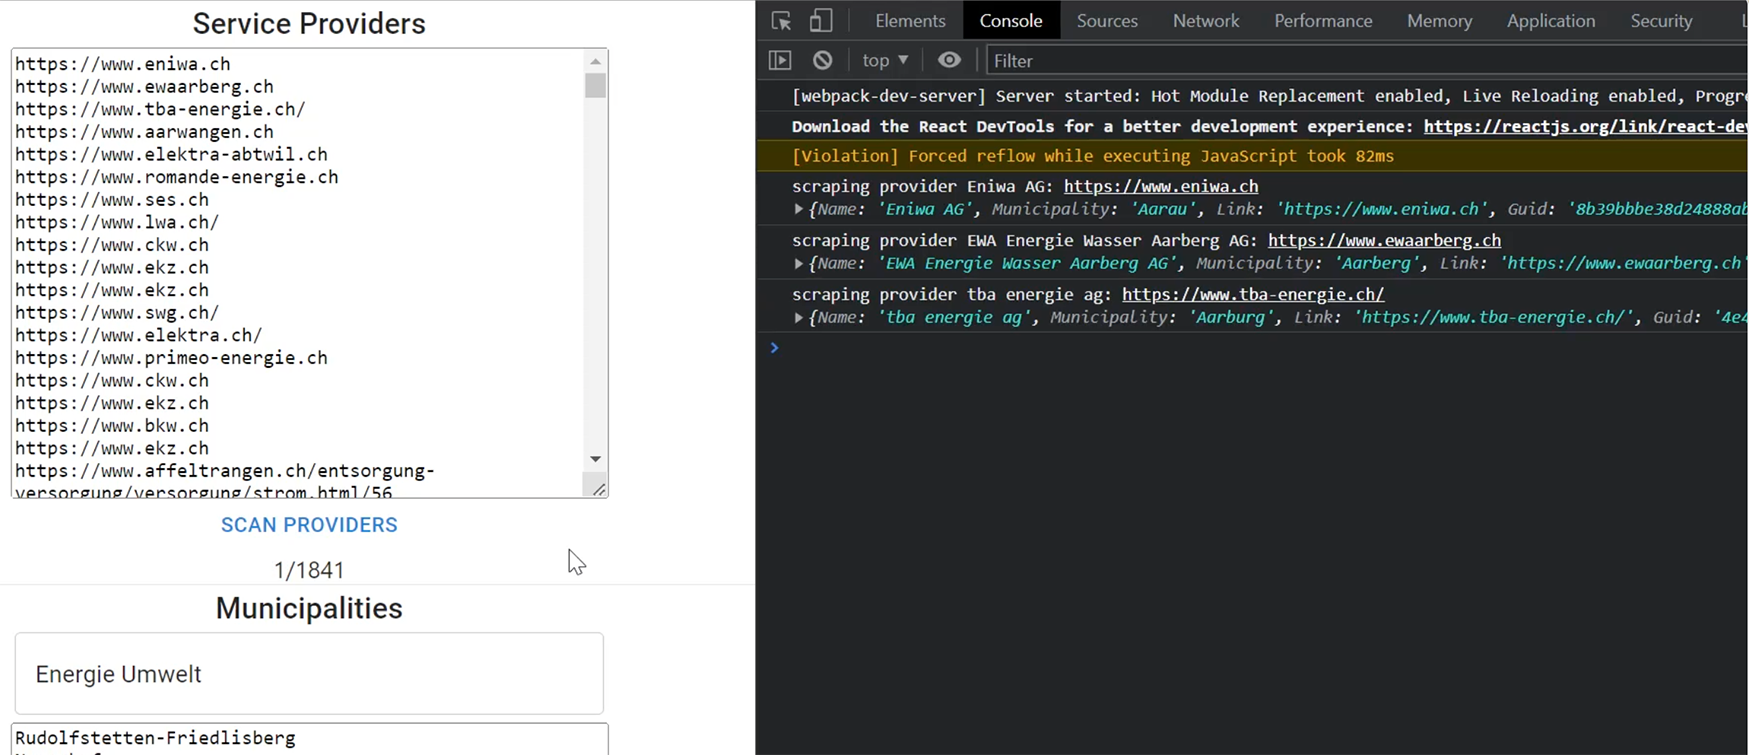
As some research revealed, there is no service or implementation which could be used out of the box, so it was decided to go for a simple prototype implementation:
Semi automatic information gathering:
- Loop over 64 municipalities as test set
- For every municipality initiate a google search with municipality name and keywords «Energie Umwelt»
- Take top 3 google results
- Pick sentences where keywords from team 1 appear
- Run sentiment analysis over retrieved sentences

Scraper result set

Scraper result set - sentences and sentiment analysis detail

Reconciliation and Validation
Bringing the pieces together, checking if it makes sense...
Results Visualization
Visualize results on map (interactive map)

Showing municipalities by keywords on map (interactive)

Sample Municipality Aadorf
Validating Sentences
Sentences analysis

Map Visualization
Analyzing details (interactive map)
- Thermal network - green
- High solar capacity (kW/cap) - red
- Energy city - blue

Final Pitch
By Jan-Philipp Sasse (with assistance of Thilo Weber)

Challenge Data and Code
See links below for Github repository (click on «Source» icon).
Energy Hackdays 2022 - Regional Energy Information
Code and project files of challenge 15 about Regional Energy Information.
Information about the challenge and documentation: https://hack.opendata.ch/project/848
Previous
Energy Data Hackdays 2022
Next project

