DataHackDayBern2021
Dataanalyse zur Impfwilligkeit im Kanton Bern

political party analysis
For the analysis with the political parties, run impfzentren.ipynb. In cell 14, set independent_var and independent_pretty to the party you want to run the regression with. E.g. for SP set
independent_var = 'wahl_sp'
independent_pretty = 'SP'
Where independent_var is one of the values from column_list in cell 13.
NB. Theoretically you can take any value from column_list and run a linear regression with it.
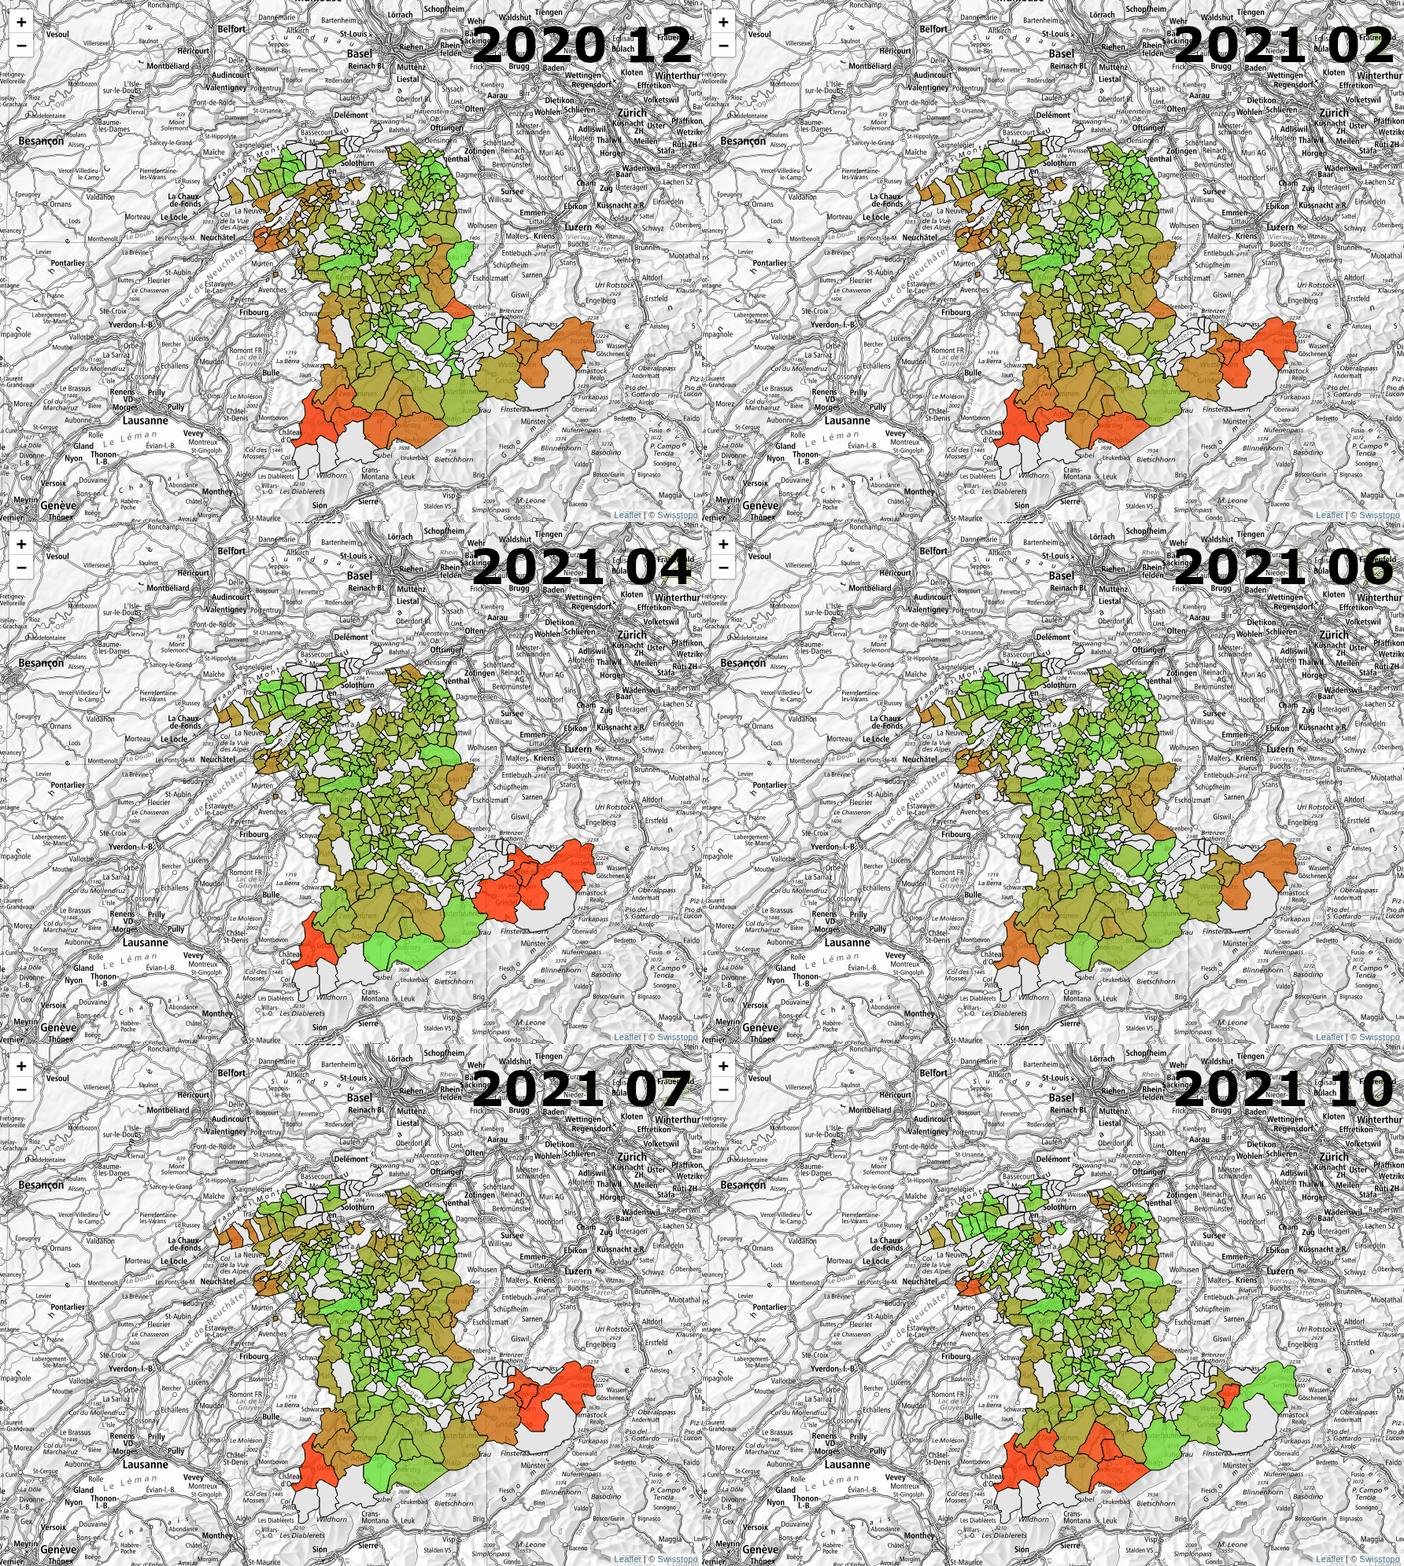
communities' progress vs. the canton's
For this analysis, just run all the cells in communities.ipynb. Create a folder called "plots" first. You will receive an error message, but that is just because Jupyter can't open more than 20 figures by default. The images will still be created.
Grafana Dashboards
Create 'clean' csv files from the raw data
Put all raw csv files in the folter Data_Private/raw and run the pythonscript.
python datenaufbereitung.py
or use the Datenaufbereitung jupyter notebook.
Start grafana and Postgres Docker:
sh start_postgres.sh
sh start_grafana.sh
Or if you want the Map plugin:
cd grafana
docker-compose up
Fill the Postgres DB with data
Find an example how to do it in write_to_db_example.py
We used a magic "drag and drop" tool to insert the csv data into the database.
To duplicate that, you need to transform the datatype of some columns (especially dates) before writing it into the DB.
Create the Dashboards in Grafana
Load Data_Public/grafana_dashboard_save.json into grafana and adapt the queries to your database shema.
Or just create a new one (is probably easier).
Previous
Data Hackdays BE 2021
Next project

