Report
💡 Active projects and challenges as of 29.07.2026 00:52.
Hide text CSV Data Package Print
BeerChain
Open Food Data Hackdays Demo
BeerChain
Anti-counterfeiting beer using blockchain. An easy QR code scan verifies if a beer is legit. The users are incentivized to scan by product gamification and BeerCoin awards. Brewers obtain instantaneous feedback on tampering of their products.
Project developed using Ambrosus API as part of Open Food Hackdays 2018, January 27th - 28th, 2018.
Open data provided by SwissDeCode.
Raw beer data (http://www.genome.beer/data).
Team
- Samuel Siegfried
- Quentin Cavillier
- Marek Kirejczyk
- Vijay Kandy
Food Theory
Improve Food Habits
- Capture an image of food
- Deep Convolutional Neural Network classifies it into several categories
- Health information derived from food category
References:
Land2Door
Build database on local farmers & open this information to consumers to foster local food choices (Canton de Vaud).
Presentation Deck Design sketch Mobile app Demo video
TEAM: Emmanuel Muller, JeanDavid Harrouet, Luca Coranzia, Ragav Lingamaneni, Veronica Estrada, Rémi Tognet Bruchet, Aurélie Barberis.
CHALLENGE
Today there is about 3600 farms in the Canton de Vaud. This number has been dropping by 23% in the last 10 years with an agriculture in constant evolution. Smaller producers have been searching for new selling models to cope with the financial pressure. To increase their margin about 20% of them are now selling their product direct to the consumer. Direct selling is tricky to set-up and certainly time consuming for farmers who are already doing more than 70 hours work a week!
In parallel, consumers are requesting direct selling! The direct selling model is more and more perceived as the future because a guarantee of quality and traceability! Lack of information on their local producers is judged by consumer as one of the strongest barrier for broader adoption. Today in Canton de Vaud there is no central point of information with up to date information to search for local food producers. This why we want to simplify local food access for a sustainable and ecofriendly model.
SOLUTION
Having this information more accessible could promote more sustainable food habits and built a stronger community. Land2Door is a collaborative and comprehensive database gathering local farmers and direct selling points. It contains data such as localization,products, seasonality, volumes. The data base is enriched either with existing open data source or farmer can directly enter their characteristics (via an App). Land2Door is to be made available via an API to open this information to the consumers or restaurants.
EXISTING DATA
During the Open Food Hackdays in 2017, web scraping was used to explore Web data sources. We assembled a list of 200 + local producers and direct selling points in Canton de Vaud. This listing was non exhaustive and some cleaning are needed. Since then, we drafted the data requirements & schema to build the database. An open source demo application to prove the data collection concept and provide an initial open API was developed in collaboration with Oleg Lavrovsky.
SCOPE of the HACKDAYS
We tackled 2 objectives during these 2 days :
- Fuel the database --> Create an app to enrol and collect data directly from the Producer.
- Foster local food choice --> Develop front end for users /consumers to locate the closest farmers based on consumer geolocalisation and shopping list.
OUTCOMES
-
Design of the mobiles apps have been sketched and shared with the team. http://f.datalets.ch/documents/1/Land2Door_-_consumer.pdf
-
Mobile app prototyped to collect data from farmers https://github.com/raghavSrih/Land2Door
-
Voice app prototyped to connect farm data to end users. https://www.youtube.com/watch?v=TjSPN8zubaw&feature=youtu.be
-
More details and screenshots in our presentation. https://docs.google.com/presentation/d/1TOG-JpoYy7X2_3D1JxvB3Wjocda4onExLnCF86nksNI/edit?usp=sharing
NEXT STEPS
1-Raise awareness and extend network in order to fund our project:
- Develop a web page to support the database.
- Test the collection mobile app on pilot farmers group.
- Test the end-users apps on pilot consumers group.
--> Optimize data interface and further populate it.
2-Develop business model for direct selling in Canton de Vaud first.
Key questions to tackle :
Prove our assumption on consumers to go for local food.
Define experiments to understand why the consumers will go on the plateform.
Find ways to advertise the idea.
Meal-Good
Pre-portioned meal-kits in Lausanne area
pre-portioned meal-kits from local residual production is offered on a weekly basis to Lausanne area. To tackle food waste as well as offer gastronomic experiences and convenience to end-users. The meal-kits are ready to be cooked, with detailed and easy recipes to be done in less than half an hour. Creative recipes from all over the world is proposed, for local ingredients for a real delight. The idea is to connect farmers with consumers in a sustainable way, and consume ethically.
Our team during this hackdays is:
- Sinan Numan @sinan_numan1
- Sarah Numan
- Marisol Giacomelli
- Francesca Conselvan
- Rosa Castillo
Our milestones for this hackdays were to work on the market study in order to validate our hypotheses and see if our offer is interesting. At the same time, work on packaging and recipes for research and prototyping.
Starting pitch: https://drive.google.com/open?id=1JhciJkOQyBCuWASZXCqxE37YYVbVTtbJsOmPl5XmHGc
Prognolite
Restaurant Managers don't know how many guests are coming next week. We solved this and other demand related problems.
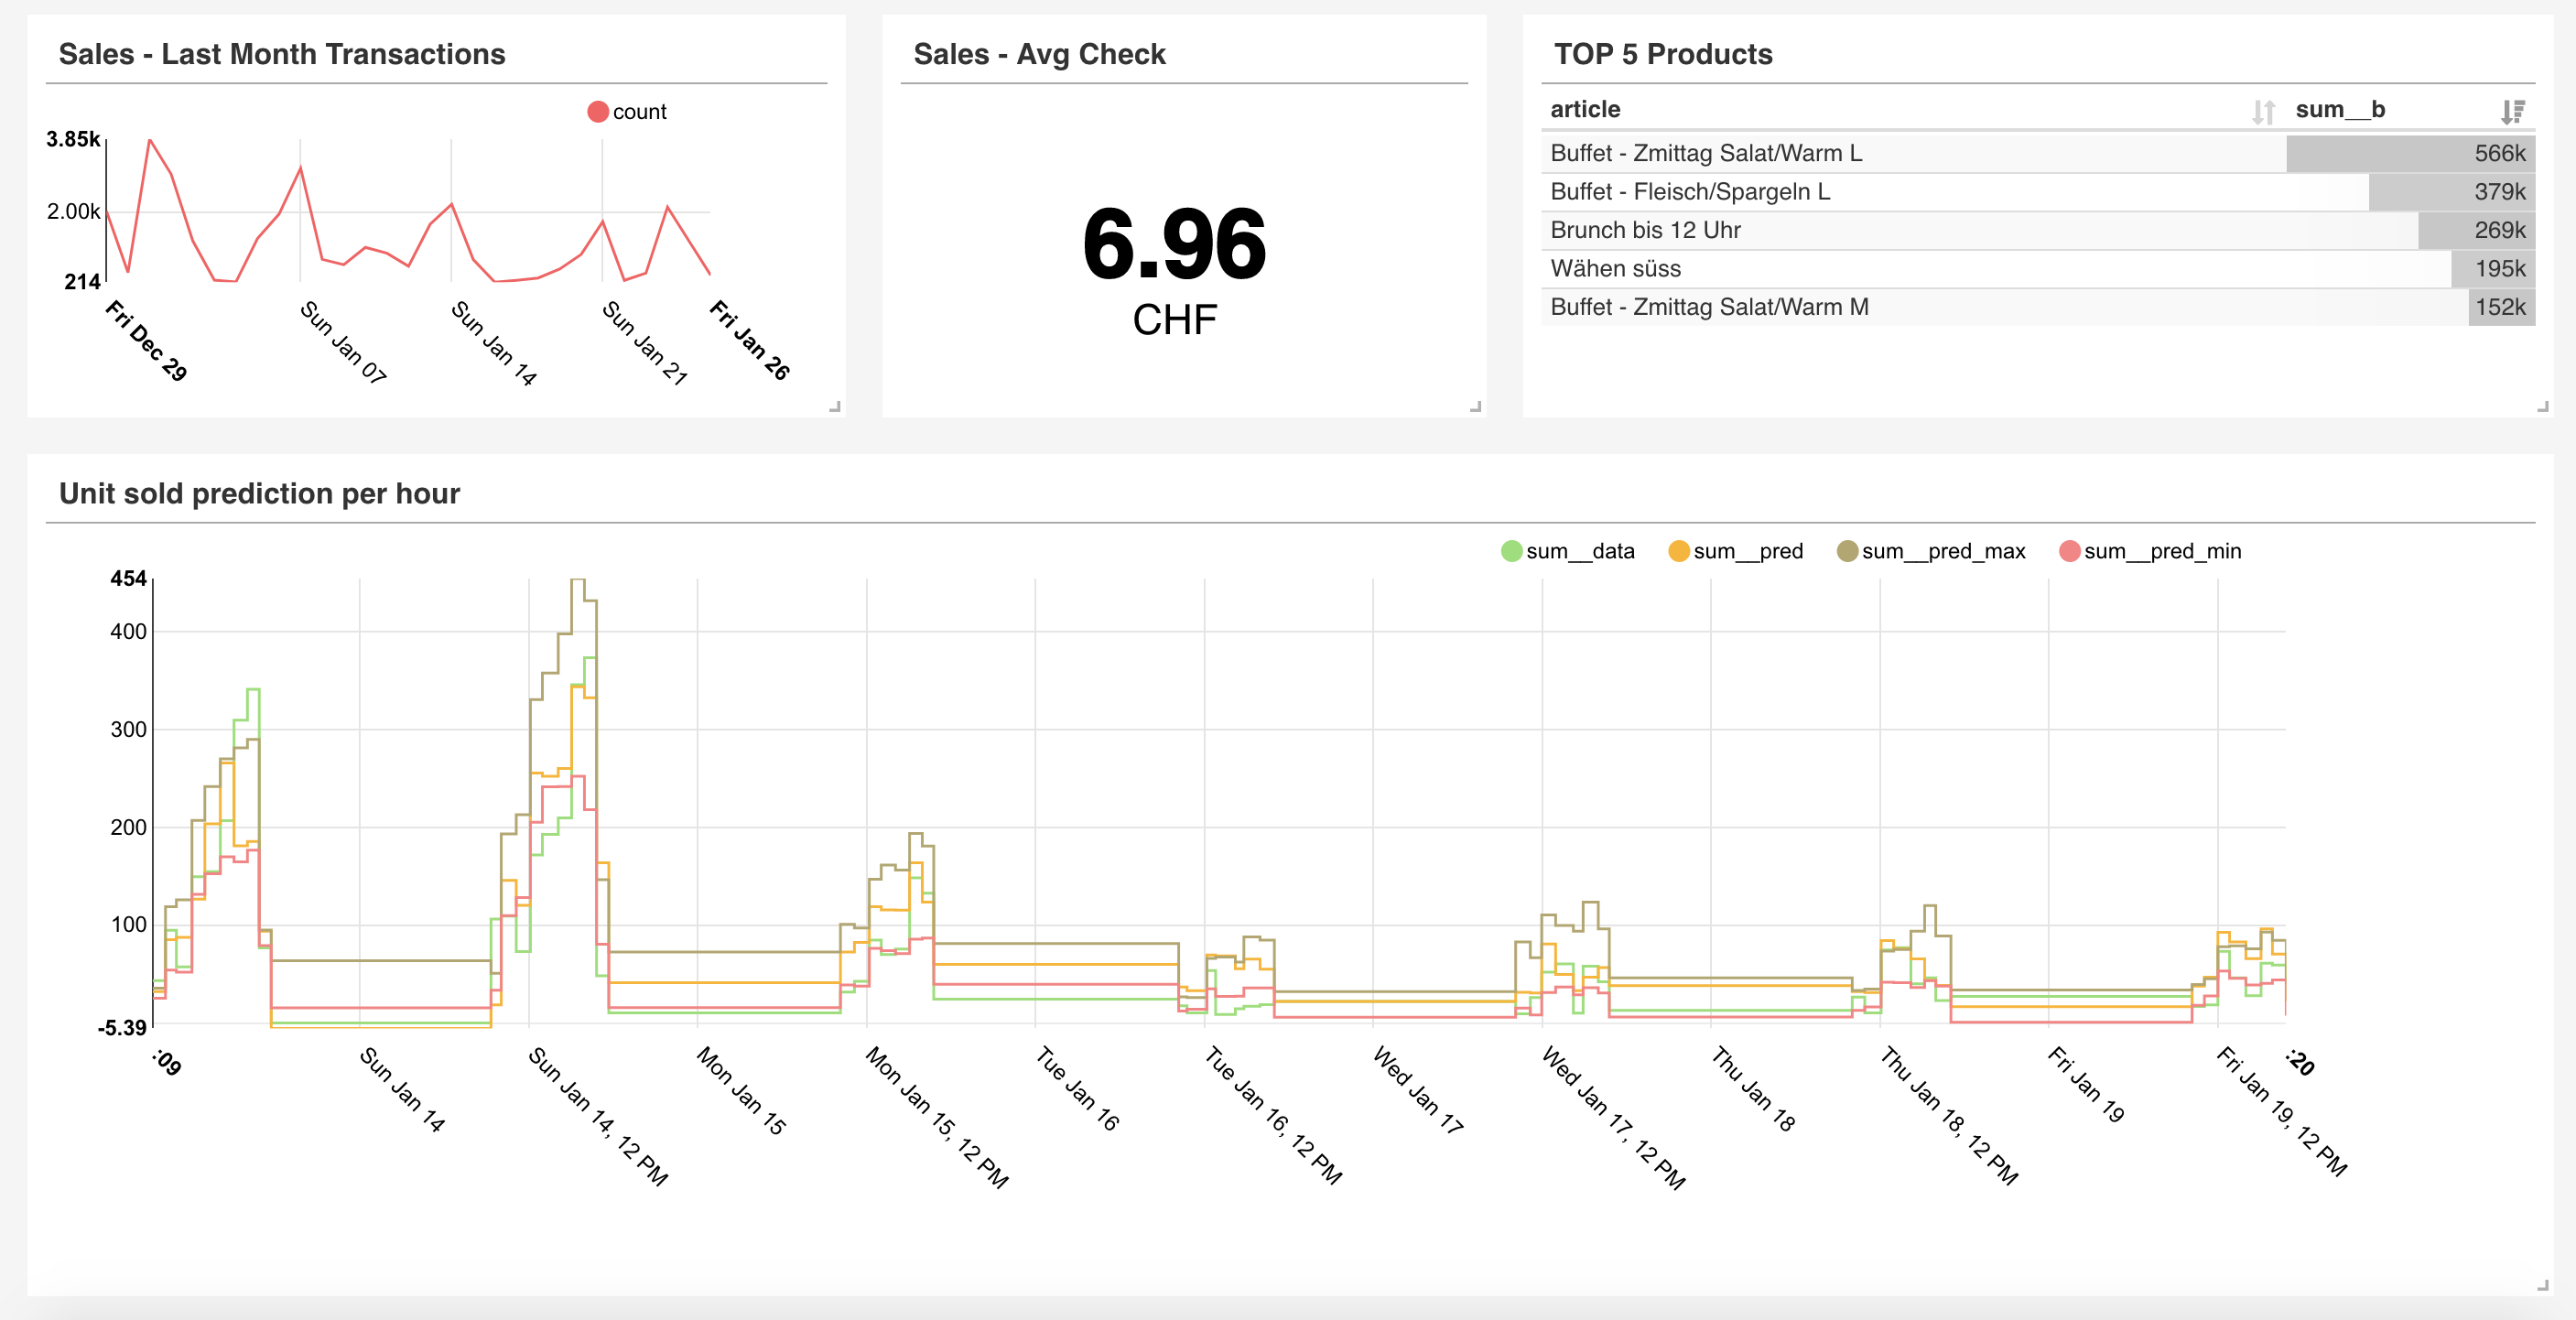
A Dashboard for Prognolite
Abstract
In the food hackathon we (@arnaudmiribel - @victor5114 - @jastaehl - @yamash - @ArnaudRobert - @musella - @Ash-1331 - @alafanechere) helped Prognolite to prototype 3 data driven use cases for their clients :
- Turnover forecasting to predict restaurant activities for better handling of food waste, staff management and customer services.
- Bundling suggestions generated from receipt collection.
- Realtime restaurant audience measurement by probe requests capture. Enabling covers estimation and forecast.
Our deliverable is a web app that displays data visualisations helping the restaurant staff to take decisions thanks to the three use-cases tackled.
Repo organization
The repository is structured as :
-
bundling: ML notebooks for product bundling from receipts
-
dashboard: Docker configurations to run a Superset dashboard
-
data_ingestion: Utils for ingesting csv into db
-
forecasts: ML notebooks for unit and turnover forecasting
-
wifi_tracking: Probe requests capture for wifi tracking
Temporary link to dashboard: http://lafanechere.me:8088
Some screenshots :
Credentials :
-
Username :
demo -
Password:
demo75
Link to forecasts outputs : https://cernbox.cern.ch/index.php/s/Rr8tSBtwvf679C1?path=%2F
Details on our methods
- Turnover Forecasting
After aggregating the training data into per-hour frames, we decided to learn three models :
- one that predicts the number of products that will be sold
- one that predicts the number of clients visiting the shop
- one that predicts how much money will be earned.
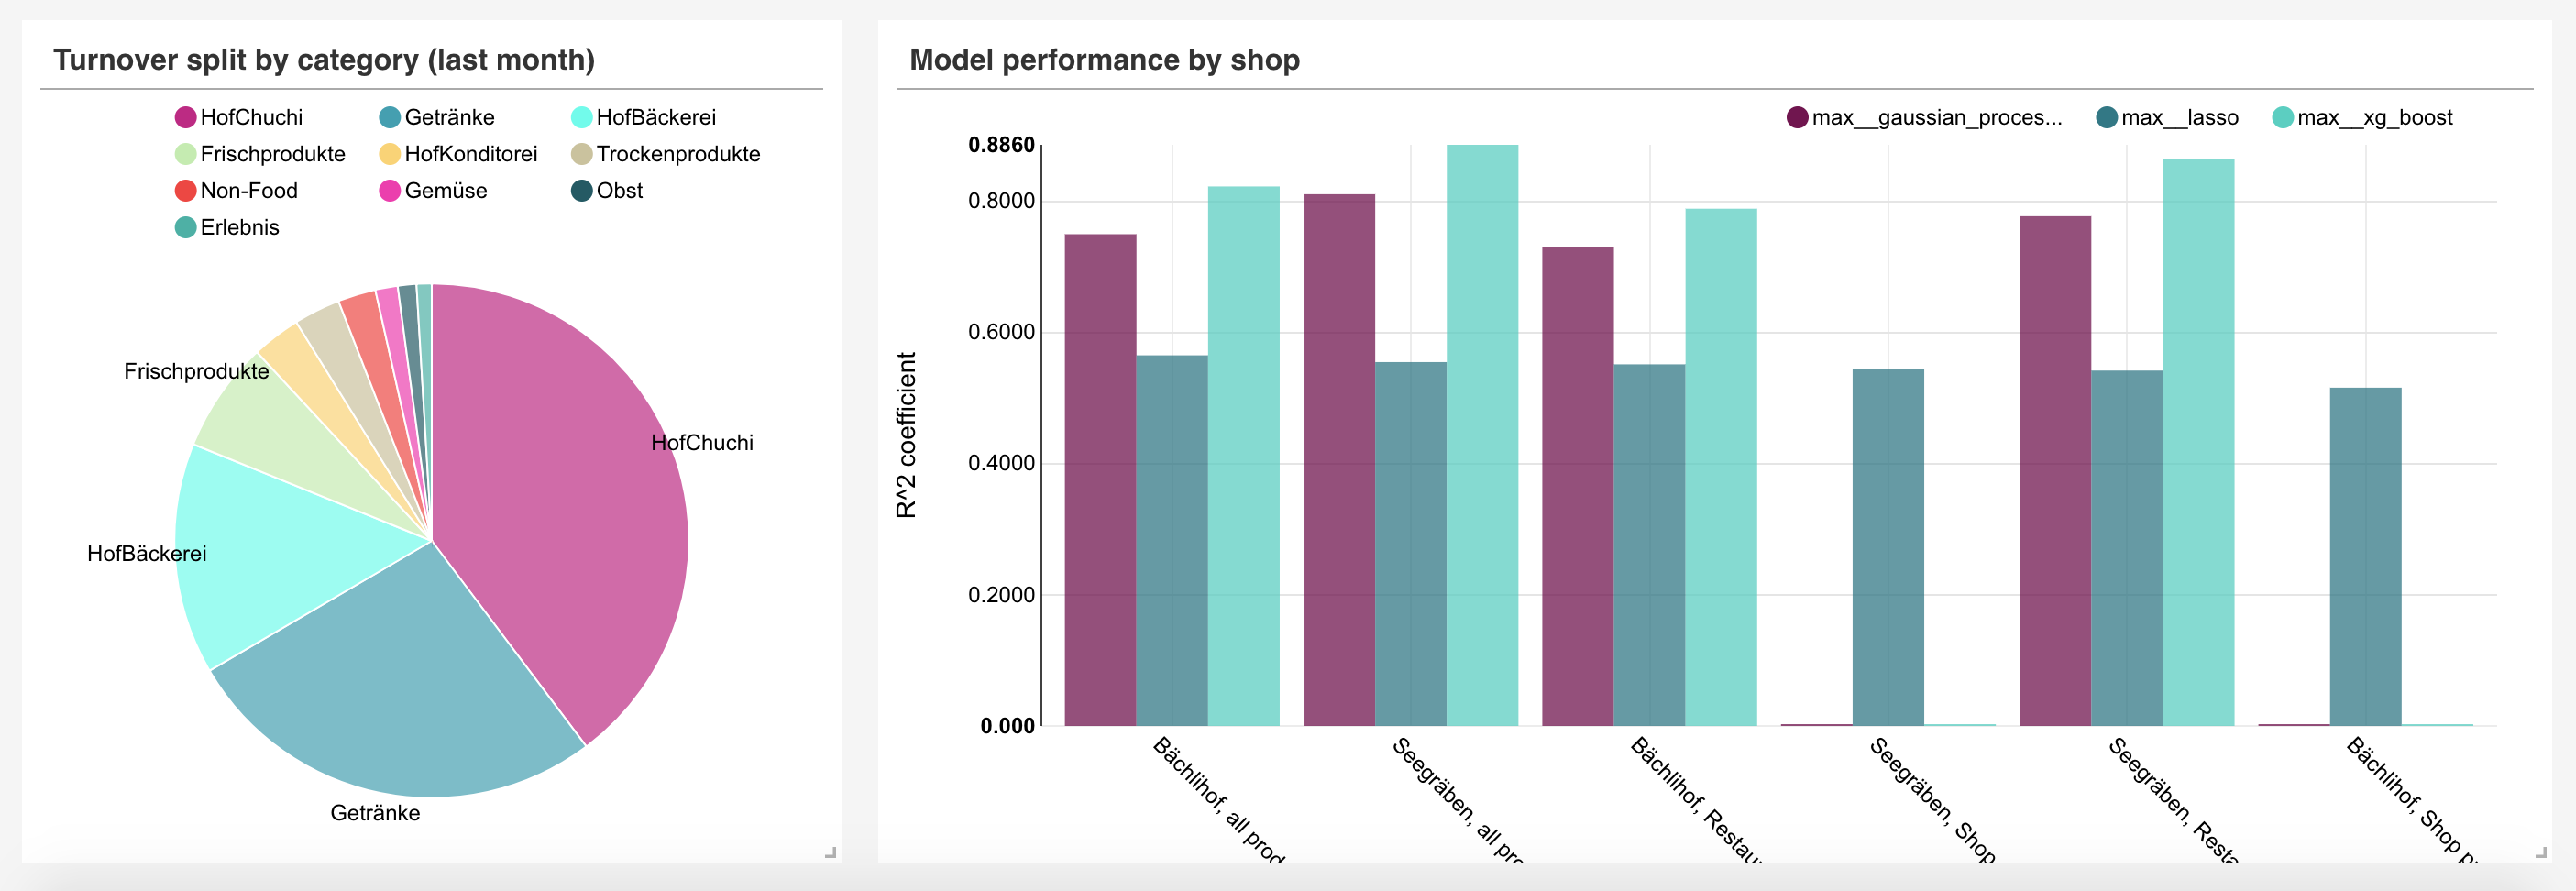
For this, we tried three models of increasing complexity : Lasso Regression, Gaussian Process Regression and finally XGBoost Regression. The predictions and evaluations of the models are displayed in the dashboard.
- Bundle Suggestions
We wanted to help the farm finding products that could be sold together. For this, we studied the historical data which consists of all the past baskets sold over last year. We applied a clustering algorithm (LDA) that seeks for latent communities inside this basket set e.g. try to find the « I’m on my way to work, just taking a take-away breakfast » basket community for example. We looked for 20 communities of baskets; such that now, when the restaurant wants to create bundles, we look inside the communities where the products have the highest weight, and extract good product candidates that could be sold with them.
- Real-time restaurant audience measurement
Knowing how many customers visit the restaurant and how much time they spend inside is crucial to determine the visitors/tables turnover in order to optimise the amount of workforce and space for the restaurant owners. To evaluate this, we take advantage of the fact that all connected devices send Wi-Fi signals (called probe requests) by listening to them and counting them. That gives us a live approximation of the traffic in the restaurant, that we display on our dashboard.
SHARPER>>
SHARPER is the next step of the SHARP tool of the FAO
https://docs.google.com/presentation/d/1CDPpmlWZCj_ZmsCUmv8bkalwJPC1uGc9OlbEmBmL0Ic/edit?usp=sharing
SHARPER>> is the next step of Self-evaluation and Holistic Assessment of climate Resilience of farmers and Pastoralists(SHARP), the tool developed by Food and Agriculture Organization of the United Nations. Through the data collected by the FAO with Sharp, Sharper will provide you with a selection of analyzed data points.
Starting point: FAO had developed a macro to provide resilience scores to each farm according to 54 markers. From this macro, general statistics were provided for each dataset.
Project: Get key insights from the general dataset and provide the next step for the tool that would provide value to the farmers who spend 4-5 hours completing the survey and wait between 3-6months for their data to be analyzed and recommendations to be provided.
Team Members:
- Florian Bienefelt
- Vincent Lee
- Lorena Edejer
Snaq on Eschernode
Estimate food portion size, nutritional value, contents automatically
Use Cases
- People will know the nutritional composition instantly.
- Identify the dish, especially helpful when people are travelling, so that they can know what they are eating. eg. Simply take a picture at a buffet and know what it is.
- Helpful to people following a diet.
First steps.
- The data set we were provided is a 700 pictures each of three different classes. Identify these classes automatically.
- Available Classes:
- Bowl plate
- Regular plate
- Soup plate
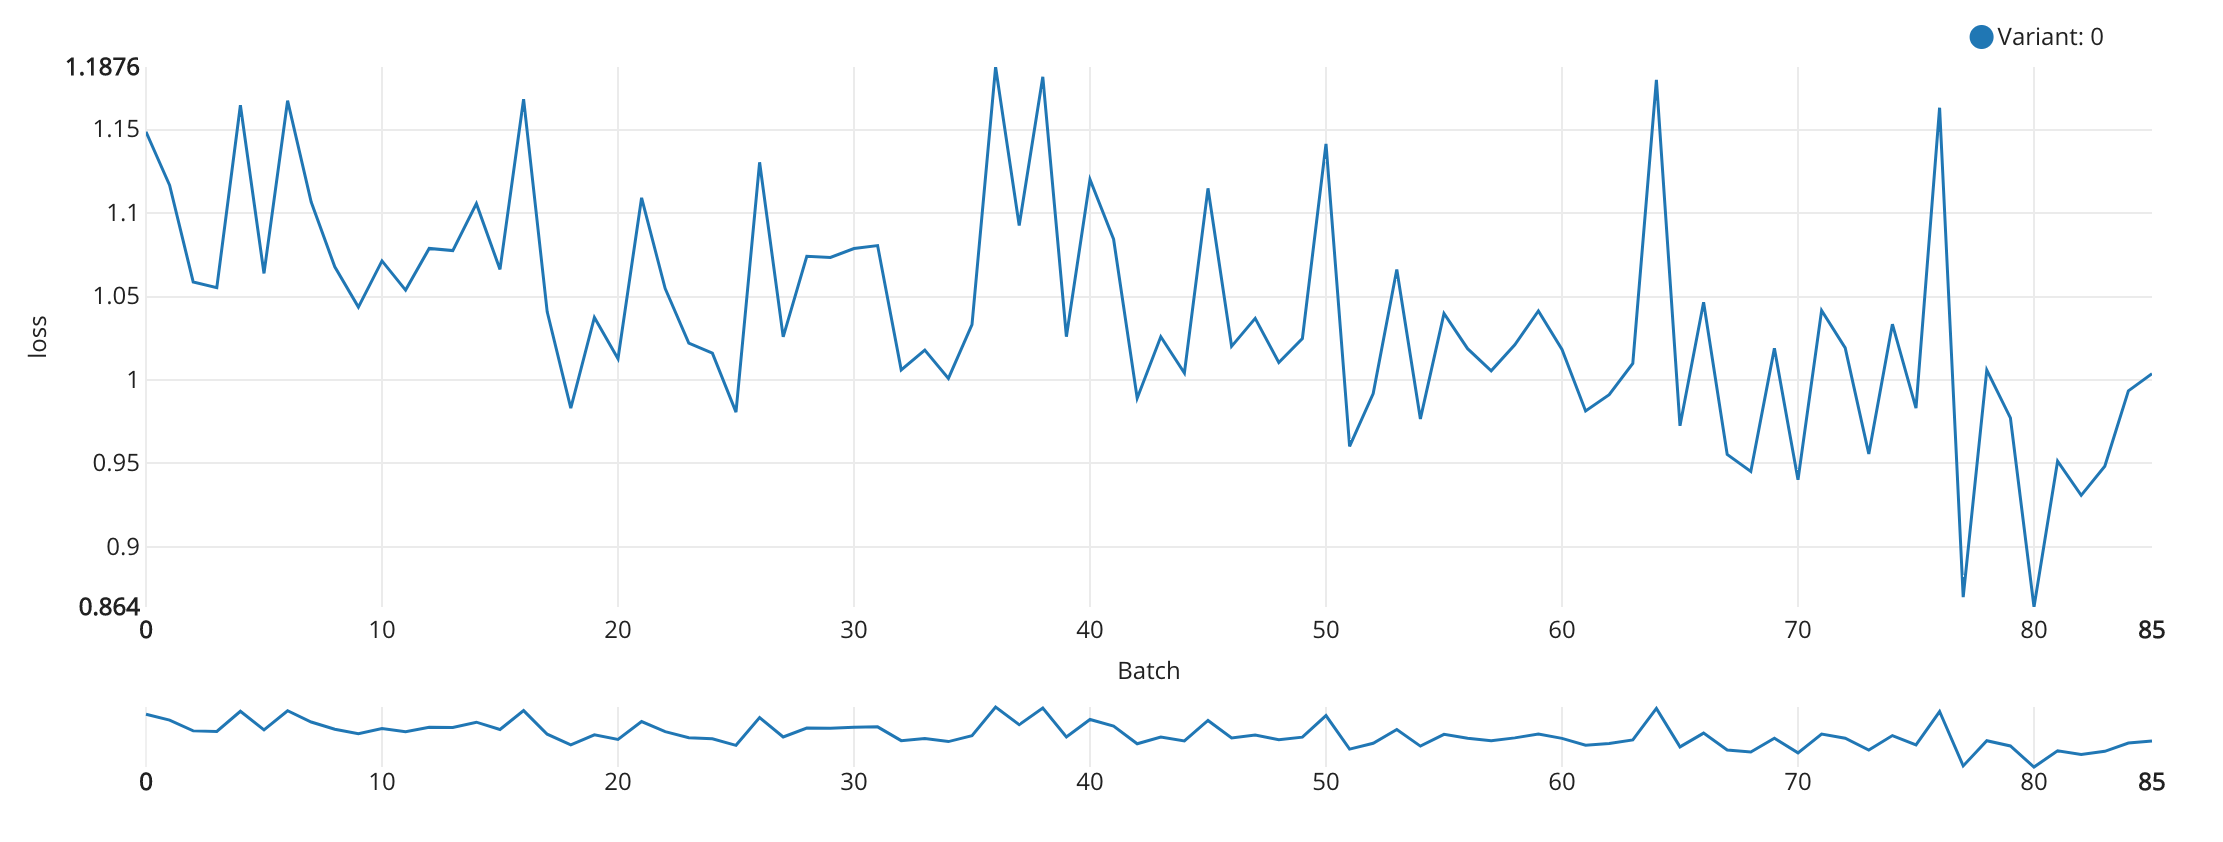
Training using Eschernode
- Trained a deep learning classifier on Resnet18 architecture.
- Trained on a 60GB machine for 5 hours.
Results
- Best Cross entropy error of about 0.863 after training for 42 epochs
Swiss Nutriscore
A nutritional score of barcoded food items in Switzerland
The challenge When we buy food from the supermarkets, we would all like to buy something which is healthy as well as environment friendly. There is unfortunately no convenient way to do this right now for Switzerland.
The solution We make an app which can scan bar-coded food items in Switzerland based on the FoodRepo and give a score of how healthy the food item is based on the standard nutriscore criteria, and will eventually be updated to also include the carbon footprint. Further it will also recommend healthier alternatives to food items which are not healthy, thus providing an easy solution to buying and eating healthy.
During the hackdays We already have a working app made during the hackdays, which gives the nutriscore of the items.
Roadblocks We are new to making apps and faced a lot of trouble in getting it to work. This experience should serve us well in the future work for the project.
Next steps The next step is to add some finishing touches and already the app in the play store within the next few days. Then we can start to add further functionalities based on suggestions and recommendations from users.
Team Kirtan Padh (kirtan.701@gmail.com) Sharbatanu Chatterjee (sharbatanu444@gmail.com)
TooSweet
TooSweet
Challenge
Non-communicable diseases (NCDs) kill 40 million people each year, equivalent to 70% of all deaths globally. One of the main factor who lead to NCDs is an unhealthy diet which is correlated with a high sugar intake. Too high sugar intake leads to chronic inflammation state in our body and therefore to constant immune reactions. Food shopping in the supermarket like Migros is done almost every day, but are you aware of all the nutritional ingredients you are buying? We think most of the people don’t check the ingredients list or are not aware about the sugar amount in their favourite daily food like they yogurt for breakfast.
Solution
We aim to make customer more aware of their main sugar contributor and will present them alternative products with less sugar. TooSweet is a mobile application who gives you a ranking of food by sugar content. The data are provided by uploading your Cumulus Data as CSV File to the App. In the App you see the sugar amount in gram of all receipts together and by clicking on one specific receipt you get the detailed ranking of this receipt by sugar content from high to low. You can click on one product to get more detailed information about the sugar contribution and alternative products ranked by sugar reduction (sugar content low to high). In the overview section you see a your sugar consumption/buying averaged over the last months over shoppings per week.
Demo
Requires allowing unsigned binaries in your Developer settings.
Datasets
Product data is used by Cumulus CSV upload done by customer. The mapping with the nutritional data about the sugar content is done with the data base of www.foodrepo.org or with Nutritional data from www.migros.ch.
Main Roadblocks
The hardest task was to implement the Cumulus data into the app, this was very important for us, as it is more convenient for the consumer and also more constant as scan. If the app would work by scan there are already several similar apps on the market and it would be more specific to make a decision in the supermarket. By using all products that a customer did buy its more real (no cheating is possible), more convenient and also an additional value to have a Cumulus Card. Open Questions: How to find alternative products, how to rank them, what are criterias, subcategories like beverages or snaks?
Futures Steps - most promising
Cooperation with Migros → Migros implementing our app idea into their Migros app → easier data handling, Migros has unambiguous data of all products → additional benefit for costumer to make Cumulus Card → possible like with Migusto Recipeis as healthier alternatives
Our Team
- Michael Hochstrasser - MSc Computational Science
- Gabriel Hochstrasser- MSc Machine Learning Engineer
- Charlotte Soland - Master Student in Food Engineering
Please contact us via the Issues page
Total Recall
How Food Traceability helps effective recall handling
Powered by Ambrosus
Current Problem with Recalls
- In 2017, there were 578 product recalls in Europe.
- The current system (RASFF) is slow and is not readily available to consumers.
- Only ⅓ of all the recalled products were recovered.
- Consumers don’t know if their purchased product is safe.
Our Solution
Information on the entire supply chain and recalls of any product readily accessible to consumers, retailers, and manufacturers.