Report
💡 Active projects and challenges as of 14.07.2026 21:41.
Hide text CSV Data Package Print
#22_07-alternative-pathways-to-net-zero
Alternative pathways to net zero
Visualization of energy scenarios
The problem
Currently, results from energy scenarios are presented in research papers or individual webpages. This makes it close to impossible for policy makers to get the full picture and understand the features of the net-zero Switzerland. How can policy-makers take decisions based on model-driven energy scenarios?
Current state
- many scenarios
- very detailed information
- not easy to extract conclusions
## **The process**
Step-by-step
|
  
|
## **The goal**
| Develop a decision-making tool to explore and compare multiple energy scenarios. The tool should visualise for each scenario key indicators and energy sources/carriers.
Target audience
Key indicators
|

|
## **The Energy Explorer**
The overview of different scenarios to compare

Click on a scenario to get the detailed Energy-flow:
.png)
## **Source code** Tool is open source and accessible through [GitHub](https://github.com/EnergyExplorer/energy_explorer)
## **The team**
- Stephane Bisinger
- Bill Zollinger

- Tristan Gollmart
- Robert Stanton
- Adriana Marcucci
- Lea Ruefenacht
#01
E-Mobility Analytics
As the discussion around e-mobility grows help with the transition to an all-electric mobility world is needed.
Challenge
Nowadays there is a lot of noise around electric mobility. As car manufacturers and the world turn towards this technology with the goal of lowering greenhouse gas emissions and as this technology gains momentum, a lot of discussions arise, bringing conflicting arguments, myths, assumptions and open questions to the surface. This we have in abundance… What we lack is real data and facts based on this data to support all these theoretical discussions.
This is where it becomes interesting! We have the real data and we are looking for data enthusiasts, who can crunch the data and generate some very interesting facts. How do we charge? How much energy do we actually need in order to cover our monthly mobility needs? Do people wait for low tariff or do they charge during the day? How does the typical charging profile look like? How about charging at work or at other points of interest (supermarkets etc.)? These and many more questions are waiting for your analytics skills and talent to be answered!
Data: Over two years of charging profiles (power consumption) timeseries in 15-minute resolution of more than 200 charging stations from the backend system of our e-mobility market product.
Aim: Analyze the data set in order to visualize the behavior of e-mobility drivers, bust some myths and support arguments with facts.
Idea: Here some interesting questions: How do we charge? How many people wait for low tariff? How many people charge their cars right away when returning home? How does the car’s charging logic work? How many cars are waiting for early morning to be fully charged (when drive-off time is preset by the driver)? Do people charge every day or only when the batteries are empty? Do people charge always on the same day? On which day of the week do people mostly charge? Typical charging profiles How does a typical charging profile look like? Which patterns are the most important ones? Place of charging How different is the charging behavior at work or at other places of interest? These and other questions need to be answered.
Big Picture: As the discussion around e-mobility grows, facts are needed to support assumptions, deepen our knowledge and help with the transition to an all-electric mobility world. Understanding the behavior of charging will help us not only better understand e-mobility as a whole, but could also open new horizons for products and services.
🧑🏼🏫 EKZ Angelos Selviaridis
#11
EMF Walks in Brugg
An energetic tour to rediscover the town
We walked around the town of Brugg with a Software-Defined radio receiver and antenna, running open source software on a laptop to capture electromagnetic field emissions - observing the interplay of radio frequencies invisible to the eye or ear. We then produced a short music video with the result. Call it data art, if you like - we had fun making this together!

🎶 Credits 🎶
- Music by Static In Verona - Etcetera Ra Ra (© 2021 Gin Rubby Music)
- Penguin illustration by George Shaw (CC BY 4.0)
- Maps and open data from swisstopo and SFOE
- Data visualization made with Gqrx running on Fedora Linux
- Radio signals measured with an RTL-SDR V3 receiver
- Video recorded with Open Broadcaster Software and produced with Pitivi
📡 Why? 📡
The town hosting our event has a turbulent industrial past and many energy-related infrastructure and historic sites, most of it well hidden behind the façades of residence and commerce. Noticing sensors, transformers, mobile phone antennas, and other sources of radio interference, we were also much more aware of the technology that surrounds us even within a short radius. Our aim is to passively observe the variety and mystery of the patterns that we encounter during our walk. With a bit of practice, we find interesting frequencies, and learn to localize sources of interference. We may start to "see" the city through a new lens, even though in our case it is just a 1-dimensional waterfall-like visualization called a Spectrogram.
What's next 🧑🏼🏫
We planned our walk using swisstopo open data shown on the GeoAdmin map shown below. Based on these locations of interesting sites, we are creating an Actionbound quest to visit the most interesting industrial sites around Brugg. We can recommend frequencies to tune into, such the ones typically emitted by public works. In the future we could offer these "high tech" tours of the smart city to school classes or tourists.
##🚶Who?🚶
- Markus (make.human.technology)
- Gaston (glam.opendata.ch)
- Oleg (dat.alets.ch)
🙇 Inspired by ⚡
#02
Energy (Heat Demand) modelling in Sankt Gallen with AI methods
Heat demand modelling and prediction for the buildings of the city of Sankt Gallen with AI methods
Demo: heatsg.energy.opendata.ch
Challenge
The department “Environment and Energy” of the city of St.Gallen is tracking and modeling the energy consumption in buildings for 20 years. The existing model is an "handmade" Microsoft Access-based model. Now the department wants to improve the heat demand model using AI methods.
Participants should bring knowledge or interest in one or several of these areas: AI, classification methodologies, data analysis, energy modeling.
Available Data:

#03
Enriching Point Clouds (LiDAR) with Meta Data
In densely populated Switzerland, high-voltage overhead lines are in many cases located in the vicinity of existing buildings.
In densely populated Switzerland, high-voltage overhead lines are in many cases located in the vicinity of existing buildings. To protect the population from non-ionizing radiation, we want to classify all buildings near power lines using public available landscape models and register of buildings. Linking this data with LiDAR data helps us to discover any non-conforming constructions and to identify buildings which should be specially protected from non-ionizing radiation.
🧑🏼🏫 Axpo Grid AG Tobias Schmocker
#09
Graph Neural Network of a Wind Farm
Modelling Wake Interactions within a large windfarm based on a Graph Neural Network.
The goal of this challenge is to model wake interactions within a large windfarm based on a Graph Neural Network. With the Graph Neural Network the turbines that have the largest impact on the Annual Energy Production of the whole wind farm due to wake interactions should be identified. This will allow wind farm operators to make specific changes to certain turbines in order to optimize the power production.
🧑🏼🏫 OST Sarah Barber, Francesca Paoletti
#12
Mapping of Swiss PV power production in real time
Task:
Based on real-time data from aliunid, develop a simple algorithm/logic to estimate the current solar radiation (Wh/m2) from PV production data (kW).Based on the obtained radiation data and the public PV data (installed power according to https://map.geo.admin.ch/ and roof area information from https://www.uvek-gis.admin.ch/BFE/sonnendach/ ) simulate the PV production in real time.
Aim
The aim is to map the total photovoltaic (PV) power produced in Switzerland in real-time without measuring each PV power plant individually. To achieve this, we want to simulate the PV power of all registered PV plants with PV plants for which aliunid has real-time data available.Idea
It is safe to assume that two neighboring PV systems follow a very similar production curve. By measuring only one of them we could simulate the PV production of both. By extending this approach to the whole of Switzerland, the challenge is to simulate the PV output of all registered PV plants with data where aliunid already measures the real-time power output. The challenge consists of the following parts: 1. Generate location-specific irradiance data based on measured PV output all over Switzerland. 2. Apply the generated irradiance dataset to PV systems that are currently not measured based on basic information and open data (e.g., installed capacity, slope, orientation). 3. Present the results (e.g., the total amount of PV power currently produced in Switzerland) on a map, dashboard, or similar.Big picture
Decentral Photovoltaic (PV) systems can be found all over Switzerland and their impact on the Swiss energy system is becoming increasingly relevant. Real-time information about each PV system helps to maximize its use and mitigate potential negative impacts. We will provide high-resolution data of the power output of PV systems all over Switzerland as well as historic weather data. Additionally, open data from geo.admin.ch and sonnendach.ch can be used#10
New interface to estimate heat demand in buildings
Development of a novel user interface/user experience for estimating the heat demand in buildings
Imagine the next generation of building modelling tool experiences
Aim:
To develop new concept for how a user could interact with our heat demand estimation API.Idea:
We have good models of heat demands in buildings, but there are many possible ways we can bring this to users. We want to imagine a user and use case and develop an interface that meets quickly their specific needs.Big picture:
Heating is the biggest consumer of energy in Swiss homes and is still 60% coming from fossil fuels. This needs to change very quickly to meet climate targets and end fossil fuel dependence. Knowing the heat demand of a building is the first step towards improving efficiency and changing heating systems.🧑🏼🏫 Dr Stefano Cozza Dr Jonathan Chambers Prof Matthias Sulzer Dr Pierre Höllmüller Xiang Li
#05
Optimizing short-term active power losses forecast
Optimizing the forecasting based on the results of these models by designing an optimization algorithm
Optimizing short-term active power losses forecast
Currently we use a group of models to forecast the short-term (day-ahead & intraday) active power losses on the transmission grid, using statistical, machine learning, and deep learning models.
The goal of this challenge is to: Optimizing the forecasting based on the results of these models by designing an optimization algorithm, to minimize the expected forecasting error and the procurement costs Designing the visualization for presenting the final forecasting results and the performance evaluation charts
🧑🏻🏫 Swissgrid AG Liu Xiying
#15
Regional Energy Information in High Resolution
Collecting, analyzing and visualizing energy policy data from Swiss communities
National energy policy goals are known and monitored, but how is the progress of the Swiss energy transition on regional level?
Working on our challenges will contributing to the current, highly relevant discussion on security of energy supply in Switzerland. You will support us to develop cutting-edge energy policy design.
Step 1: Web scraping energy policy goals
Find and gather information about energy policy goals and activities of municipalities. Identify ambitious and less ambitious municipalities Optional: Cluster municipalities that follow same/close goals and benchmark
Step 2: regionalize renewable energy production
How much production in Swiss municipalities? Data wrangling and fusion
🧑🏽🏫 GeoImpact/BfE Digital Office
Project Team
Who has which skills and is in which team - policy (P), data (D), scraping (S)

- Emilie Boillat
- Guiseppe Caponetto
- Peter Janes («Piet»)
- Baptiste Jordan
- Manuel Meyer
- Lukas Oberholzer
- Matthias Pauli
- Peter Robineau
- Jan-Philipp Sasse
- Alexander Thommen
- Lucas Tochtermann
- Thilo Weber

Team 1 - Policy and Data
Which energy policy keywords and categories are relevant?
Step 1 - Brainstorming Keywords

Step 2 - Structuring Keywords
Clustering brainstorming results mind map and converting to a structured table

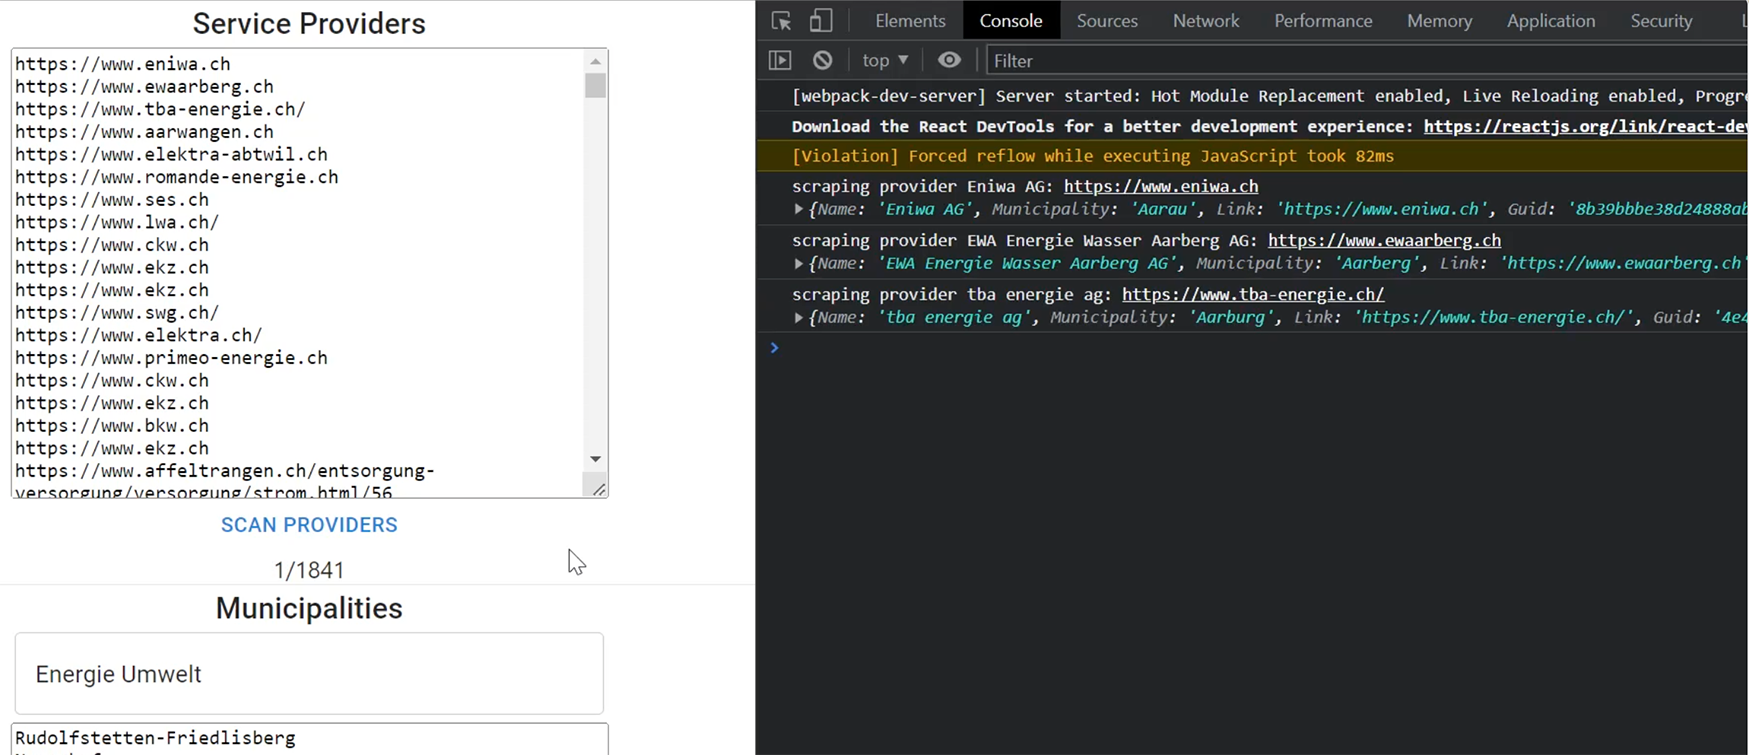
Team 2 - Web Scraping
Finding energy policy information on Swiss municipality websites.
## Step 1 - Manual Samples
Manually retrieving text data from few sample municipalities

Step 2 - Building a Scraper
As some research revealed, there is no service or implementation which could be used out of the box, so it was decided to go for a simple prototype implementation:
Semi automatic information gathering:
- Loop over 64 municipalities as test set
- For every municipality initiate a google search with municipality name and keywords «Energie Umwelt»
- Take top 3 google results
- Pick sentences where keywords from team 1 appear
- Run sentiment analysis over retrieved sentences
Scraper result set

Scraper result set - sentences and sentiment analysis detail

Reconciliation and Validation
Bringing the pieces together, checking if it makes sense...
Results Visualization
Visualize results on map (interactive map)

Showing municipalities by keywords on map (interactive)

Sample Municipality Aadorf
Validating Sentences
Sentences analysis

Map Visualization
Analyzing details (interactive map)
- Thermal network - green
- High solar capacity (kW/cap) - red
- Energy city - blue

Final Pitch
By Jan-Philipp Sasse (with assistance of Thilo Weber)

Challenge Data and Code
See links below for Github repository (click on «Source» icon).
Energy Hackdays 2022 - Regional Energy Information
Code and project files of challenge 15 about Regional Energy Information.
Information about the challenge and documentation: https://hack.opendata.ch/project/848
#17
Smart-Meter CII Interoperability with Smart-Home Systems
Connect ten common smart meters to a data broker, establish a common information schema and develop apps and visualizations
In last year's CII -challenge, we have demonstrated how 4 Swiss DSO smart-meter (SM) deliver their energy data through their local Customer Information Interface (CII, like M-BUS oder DSMR) by using specific IoT-Adapters that will publish the data towards a common interoperability layer, the MQTT-broker.
This year, we shall extend the range of SM to include further SM like Ensor, Kamstrup, Sagemcom and explore others. We also intend to deploy some new SM-powered IoT-Adapters to allow DSO-customers easy and reasonably inexpensive local access to their energy data. And we shall report on the issues encountered with MBUS-HDLC-DLMS-COSEM, DSMR and other types of CII.
The second part of the challenge shall investigate and show how the many EMS or smart-home systems (SHS like Loxone, KNX, Homeassistant, openHAB, ioBroker, and more) may obtain the energy-data by subscribing to the MQTT-broker.
We also intend to explore how to integrate the hourly next-day price forecast from ENTSO-E over MQTT. EMS, SHS or even the IoT-Adapters may display this information or take sensible load-shifting decisions to flatten their power use.
Because of much higher energy prices, PV system operatores may lose their previous economic incentive to use as much energy as possible from their own production for their local loads. Instead, local loads may be shifted to times of relativly lower energy prices which also nicely indicate less expected load.
🧑🏼🏫 Gantrisch Energie AG and Partner
#16
SolarDAO - The Digital Energy Cooperative
Accelerate the energy transition by making investment in renewables more flexible and inclusive.
Background
e-swissolar
We exist to work at the intersection between transformative technologies and renewable energies. We are passionate to work on the creation of innovative financing instruments, decentralised energy networks or energy marketplaces. We aim to create sustainable value across the whole energy value chain for our stakeholders and for the society.DAO
A Decentralized Autonomous Organization (DAO) is an organization whose rules are in computer code. DAOs are performed according to computer-coded rules (smart contracts), for example on a blockchain, and are subject to the joint work of their employees and members of the organization [1]. On the 27. & 28 März 2022 during the [Open Legal Lab] (https://challenges.openlegallab.ch/project/47) we created a legal structure for a DAO that will facilitate direct investments in PV-Systems in Switzerland that is Blockchain compatible and legally compliant.Energy Communities
e-swissolar AG believes that energy cooperatives are highly relevant for the energy transition. An energy cooperative is a non-profit organisation whose purpose is to locally produce and deliver renewable energy to its stakeholder or members. Members jointly own and democratically control the cooperative. Cooperatives around the world share the same seven principles, which are based on values such as democracy, equality and solidarity.Watch the video about the 7 cooperative principles:
ReFi
In 2021 in collaboration with the HSLU Institute of Innovation and Technology Management an Innocheque for e-swissolar’s innovative idea ReFi -Regenerative Finance for Smart Energy Communities (54557.1 INNO-EE) has been conducted. ReFi is an investment platform built on top of a blockchain network that has the potential to efficiently and cost-effectively mobilise and redirect funds to small-scale projects owned by private persons or energy communities not eligible for traditional funding sources. Fractional ownership-enabled tokenisation and decentalised finance has the potential to unlock investment at various levels from retail investors to institutional investors with less risk due to a liquidity lending pool. This peer-to-contract (many-to-many) borrowing/lending scheme with blockchain yields a faster financing process with no underwriting and due diligence costs. ReFi offers transparency, collaboration and fair governance for domestic energy communities, public and private investors, and DSOs as a first step; with endless possibilities that can be built on top later. In 2021 e-swissolar developed a [prototype] (https://refi-near-hackathon.vercel.app/) deployed on the AURORA blockchain testnet. Distributed Autonomous Cooperative (DisCoo) We are currently working on the development of the core architecture of the smart-contracts system and of the smart-contracts trying to build up a minimum prototype (backend) of a legally compliant decentralised autonomous cooperative. More information will follow soon... Pilot More information will follow soon... ##Problem Financing A big barrier slowing the development of both new and existing energy communities is the lack of accessible, targeted and consistent funding and financing. REScoop identified following barriers:- Limited access to bank financing and financing tools
- Lack of financing tools for initiating energy communities Manage Stakeholders & Resources Energy cooperatives are relaying on the active participation of citizens and the involvement of multiple stakeholders (local authorities, local economic players, other cooperatives, etc.). Some citizens become members of the cooperatives, i.e. owners and users of the cooperative. Following challenges have been identified in this regard REScoop:
- Organisation of members
- Information and transperancy
##Solution Financing
- Create specific financing tools for energy communities
Manage Stakeholders & Resources
- Innovative Tools for Governance
##Challenge
In the context of the identified problems and proposed solutions, what are the design criteria and patterns (elements) that constitute the SolarDAO. We will use the DAO Canvas developed by Felipe Duarte. The canvas is to guide groups through the process of making the most vital decisions they face in the process of imagining their DAO. We created a miro-board where we will collectively work on the DAO canvas. Further data about energy cooperatives will be provided during the event.

##References [1] [Decentralized Autonomous Organizations (DAOs) as subjects of law - The recognition of DAOs in the Swiss legal order] (https://libra.unine.ch/export/DL/40516.pdf)
[2] [Schmid, Benjamin; Seidl, Irmi (2022). Energy Cooperatives in Switzerland: Survey Results // Energiegenossenschaften in der Schweiz: Befragungsergebnisse. EnviDat.] (https://doi.org/10.16904/envidat.349)
##Call for Action We are looking for energy & tech-enthusiasts, -students, energy cooperatives, municipalities or utilities who are interested to explore with us new ways of using transformative technologies for realising the energy strategy 2050. You will help us to design right solutions for energy cooperatives.
#04
eco-friendliness score
The topic of energy has arrived at the center of society, and we are beginning to understand that we can change our behavior in a positive way. Data is of value to people because it enables them to develop a better understanding of themselves and the world around them. Data from fitness trackers, for example, help to benchmark one's own body/fitness and to derive motivation for behavioral changes from it. In order to be able to act and being incentivised, one needs a benchmark (score). For future flexible tarif models, an underlying metric is needed. In a decentralized, renewable energy system the customer plays an increasingly active role For exemple by using energy when renewable energy is abundantly available and by reducing one’s consumption when there is a scarcity To show customers their potential for improvement, we would like to introduce a simple score based on individual consumption patterns. This score ensures transparency and creates the basis for effective incentive measures.