
Report
💡 Active projects and challenges as of 16.06.2026 14:05.
Hide text CSV Data Package Print
Cheapest Charging Around
Weiterentwicklung der BfE-Info-Plattform; «Ich tanke Strom.ch»; Verbesserung der Transparenz
Github repo: https://github.com/OpenEnergyData/Cheapest-Charging-Around
(English below) #Günstigste Lademöglichkeit in der Umgebung (#4)
Ziel
Weiterentwicklung der GIS-Plattform vom Bundesamt für Energie (BFE): Preisinformationen integrieren und die günstigste Lademöglichkeit in der Nähe für Elektroautofahrer finden.
Idee:
Ein Charge Point Operator (CPO) ist eine Firma, die einen Ladestationen-Pool betreibt. Der CPO stellt smarte Ladestationen den E-Mobility Service Providern zur Verfügung (EMPs). Ein EMP ist eine Firma, die Ladeleistungen den Elektroautofahrern anbietet, z. B. mit einer Zugangskarte zur Identifizierung und Aktivierung des Ladenvorgangs und entsprechenden Ladeabonnements. Der EMP ermöglicht dem User den Zugang zu einer Auswahl von Ladestationen in einer bestimmten Region. Eine Firma kann beides CPO und EMP sein. Unterschiedliche EMPs haben unterschiedliche Preise für das Laden an der gleichen Ladestation. Die Idee ist, die günstigste Lademöglichkeit für den Kunden eines bestimmten oder mehrerer EMPs zu finden.
##Warum: Grosse Preisunterschiede existieren heute zwischen den unterschiedlichen EMP Preisen für das Laden an der gleichen Ladestation. Diese Lösung soll die Kunden besser informieren und ihnen helfen, die beste Preisoption auszuwählen. Die Transparenz ist erhöht und die Market Performance ist verbessert.
##Data
- Ich-tanke-strom.ch auslesen
- Preisinformationen von EMP/CPO Webseiten auslesen
- Statistical and availability information available in .json format: https://opendata.swiss/dataset/ladestationen-fuer-elektroautos.
#Cheapest charging around E-Mobility - further development of ich-tanke-strom.ch
Goal:
Further development of the GIS platform of the Swiss Federal Office of Energy (SFOE): Add price information to the charging stations and find the cheapest option around for electric car drivers.
##Idea: A Charge Point Operator (CPO) is a company operating a pool of charging points. A CPO provides value by connecting smart charging devices to E-Mobility Service Providers (EMPs). An EMP is a company offering an EV charging service to EV drivers. EMPs provide value by enabling access to a variety of charging points around a geographic area. One company can be CPO and EMP at the same time.
As a result, at each charging station of a certain CPO pool, different EMPs have different prices. The idea is to find the cheapest charging station around a user according to their EMP subscription(s).
Big picture:
Big differences in EMP prices exist at certain charging stations. This solution should help users to choose the best pricing options. Transparency and market performance is increased and the user/consumer is better informed.
Data:
- Get information from Ich-tanke-strom.ch
- Get information from EMP/CPO websites
- Statistical and availability information available in .json format: https://opendata.swiss/dataset/ladestationen-fuer-elektroautos.
Update: Removed old not continued documentation: https://md.schoolofdata.ch/7wV5czYKSb2R6_zJiD8PyA#
28.08.2020 19:11
Cheapest-Charging-Around-Open-Energy-Data-Hackdays
Challenge goal
Further development of the GIS platform of the Swiss Federal Office of Energy (SFOE): Add price information to the charging stations and find the cheapest option around for electric car drivers.
Compile the price information: not so easy at it may seem
Finding the prices
What we needed was of course the list of the prices for every provider coherently compiled and available for comparison. At the very beginning we toyed a little with the idea of scraping the provider's websites to harvest the price information. This approach was quickly proved as unfeasible since for many providers the price structure is not even clearly published and, even when it is, each provider present it in its own way or only through their proprietary mobile app. Public APIs are not available and we had to scrap that approach too.
At the end, we resorted to manually look for and extract the pricing information from the various websites. For time reasons we limited ourselves to three of the biggest providers.
Price structure consolidation
KWh, per minute, per hour, monthly abo, yearly abo, one-time fee per plug-in, flatrates, roaming... and many permutations of all that. The pricing landscape is obscure and confusing. We thus spent quite a lot of time looking for a way to model this variety and compile it in a single table.
We settled for the concept of "tariff plan" as our object. Discriminating parameters are the tariff provider, the roaming partner, time of the day, power type and KW at the plug. With such a structure we are able to filter for the chosen plug paramenters and present the user the tariff plans available for that particular plug. As far as pricing information goes, we could not really consolidate it to a single measurement unit (ex: chf per KWh) because of the diversity in the pricing structures. Therefore, for each tariff plan we show the price in the same measurement units given by the provider. Because of this, it was also not possible to give the final charge price to the user to fill the battery. In addition, this would require a lot of information about the vehicle that are here out of scope.
Main problems
As already stated, we faced several problems during our data collection and consolidation process.
- The pricing data is not publicly available, or very hard to find.
- Some pricing information is available only to registered customers.
- There is no common denominator across the tariff plans across different providers. And even within the same provider we found often huge differences in price calculations. Comparing the various tariff plans is therefore almost impossible.
- We did not manage to harvest the price structures programmatically and had to resort to manual work.
- The price also depends on the car type (max. kW input, battery volume etc.)
Our solution
To allow a user to compare the available tariff plans for a given charging station we combined the following elements:
- A leaflet webmap. The map uses the publicly available geoJSON from the Federal Spatial Data Infrastructure (FSDI) to visualize the charging stations.
- The freely accessible FSDI API at api.geo.admin.ch to retrieve the full station and plug informations
- Our static table (filled as a google sheet then transformed to JSON for the webapp) with the tariff plans information.
When the user picks a charging station, the application retrieves the ID from the geoJSON and then uses it to make an API call to api.geo.admin.ch. This retrieves all the needed information about the available plugs at the station. The app then filters the tariff table to present the valid plans and the pricing information.
Filter parameters are:
| API result attribute | Tariff table attribute | |
|---|---|---|
| Provider This looks for al the tariff plans valid for the selected station's operator |
OperatorName | tariff_provier |
| KW Some tariff plans depend on the available power at the plug. |
QueryChargingFacilities | valid_kw |
| Time of the day Some tariff plans depend on the time of the day. |
- | start end |
| Power time Some tariff plans depend on power type (AC or DC). |
QueryChargingFacilities | powertype |
Data model of the tariff table
You can find the table here
| Variable name | Description |
|---|---|
| tariff_provier | String Name of the provider offering this tariff |
| roaming_partner | String Name of the roaming partner for this tariff. Is the same as tariff_provider if not a roaming tariff |
| tariff_name | String Name of the tariff |
| valid_kw | String Comma-separated list of the plug powers using this tariff |
| start | hh:mm:ss Validity start for this tariff plan |
| end | hh:mm:ss Validity end for this tariff plan |
| powertype | String "AC", "DC" or "AC, DC" where the info is not available |
| flatrate | Boolaen Informs if the tariff is a flatrate one (pay once, charge unlimited without additional costs) |
| chf_plug-in | Float Base fee just to plug-in the car, in Swiss Francs for this tariff |
| chf_minute | Float Fee in Swiss Francs per minute plugged in |
| chf_kwh | Float Fee in Swiss Francs per KWh delivered by the plug |
| chf_month | Integer Cost in Swiss Francs of the monthly subscription |
| chf_year | Integer Cost in Swiss Francs of the yearly subscription |
Known problems and possible ameliorations
Ours is a rudimentary solution that must be considered as an early-stage POC.
The main issues are:
- A static and still rudimentary tariff "database"
- Incomplete tariff data
- Data model has to be optimized
- Filter to be revised
- Not integrated with ich-tanke-strom.ch
- Impossible to calculate the total cost of a charge
- Still almost impossible for a user to make meaningful comparisons because of the different price calculations
- Car parking costs are not considered
Outlook and needed ameliorations
- Include more operators
- Automatic fetching of updated tariff information
- Integration of the data into ich-tanke-strom.ch
- Integration user data such as car type, battery status, ...
- Integration of parking costs
- Develop a real webapp :smile:
Lessons learned
- The data needs to be open, easily and freely accessible in order to develop such an applications
- There is a need for a standard way to describe the costs ot make a meaningful comparison possible
- It is a pleasure to work with the freely available DIEMO data (both the static JSON than via the FSDI API)
- Open Data is nice!
Client-Analysis 2.0
and the power of open data
Challenge
Kundensegmentierung/-Analyse auf Basis offener Daten vs Daten eines Energieversorgungsunternehmens. Beispiele haben bereits gezeigt, dass eine Kundenanalyse/Kundensegmentierung auf Basis offener Daten bereits möglich ist und es keine Kundendaten mehr benötigt. Ist dem so und wenn ja, wie sieht es aus?
Distributed analytics for asset management
Using AI to predict how power transformers will fail, and what to watch out for
(Challenge #13)
This task will create a decision support tool for asset managers. The utility asset manager will be able to put results of transformer inspections into the tool and receive:
- A health value for the transformer ("condition-based rating")
- A comparison of the transformer's health with other transformers from all over the world
- Possible faults, based in particular on gas levels
- A prediction on how the transformer's health will degrade in the next 1-2 years, based on how similar transformers have behaved
- Advice on what gas levels to monitor, and how to watch them
A central part of the task is to conduct the analysis without a centralised dataset, and without being able to see the asset information of other transformers. The analyst is working blind to protect the privacy of the transformer owners! This is achieved using TAC, a system provided by the challenge sponsor, VIA.
The steps we are taking in the hackathon are:
- To identify typical condition curves
- To match these curves to the test transformer
- To map the changes in health over time for the matching transformer, in particular looking at gas levels
- To predict how the test transformer will change with time by generating a heatmap and plotting the test transformer to the heatmap
- Visualisation and business value!
We have four datasets that we can use:
- A global repository of transformers that we access using VIA's privacy-preserving TAC system (including fault information)
- An anonoymised database of Swiss transformers
- A list of faulty transformer readings, from the IEC60590 standard
- A list of normal transformer readings, from the IEC60950 standard
The decision support tool will be combined with online and offline asset management approaches. It will be combined with load and geospatial data to create an exploitable tool.
31.08.2020 12:37
Prototyping has been completed and now the project will be taken forward for funding
31.08.2020 12:38
E-Mobility Behavior Analysis
(English below) #Analyse E-Mobilitätsverhalten (#5) ##Ziel: Antworten auf Fragen bezüglich Mobilitäts- und Ladeverhalten in der neuen Ära der Elektromobilität. ##Idee: Öffentliche und historische Daten analysieren, um Klarheit bezüglich des Themas Elektroautos zu schaffen und Fragen beantworten, wie:
- Wie und wann bewegen sich Menschen heute?
- Wie, wann und wo laden Elektroautofahrer ihre Autos?
- Wie vergleicht sich eine öffentliche mit einer privaten Ladestation bezüglich Nutzung, Nutzungszeit, Nutzungsdauer usw.?
- …? ##Warum? Die heutige Situation der Elektromobilität verstehen, so dass man sich die Zukunft vorstellen kann und den benötigten Infrastrukturausbau (Verteilnetz, private Ladeinfrastruktur zu Hause) planen kann. ##Daten:
- Anonymisierte Profile von privaten Ladestationen in Mehrfamilienhäusern
- Historische Daten von öffentlichen Ladestationen aus ich-tanke-strom.ch (10GB Daten Feb. - Aug. 2020)
- Öffentliche Daten aus anderen Quellen
#E-Mobility behavior analysis ##Goal: Find answers to questions regarding mobility and charging behavior in the new era of electric mobility. ##Idea: Analyze open and historical data to get a clear understanding of the situation regarding electric cars by answering questions like the following:
- How and when do people move?
- How, when and where do people charge their electric cars?
- How does a public charging station compare to a private one in terms of utilization, time of use etc.?
- …?
##Big Picture: Understand the present situation regarding electric mobility in order to be able to imagine how the future will look like and plan the infrastructure development needed (electrical distribution grid, charging infrastructure at home) accordingly.
##Data:
- Anonymized profiles of private charging stations in multi-family homes
- Historical data of public charging stations from ich-tanke-strom.ch (10GB of data from Feb. to Aug. 2020)
- Open data from other sources
28.08.2020 13:24
28.08.2020 17:34 mockup for our emobility behaviour dashboard done.
29.08.2020 13:11 presentation & live demo of our amazing dashboard
Energy Hackdays 2020 Group 05 e-mobility behavior analysis
Erica Lastufka, physics @ www.fhnw.ch | Florence Meier, Full Stack Developmant (focus on frontend) | Benedikt Ramsauer, Data Scientist @ www.swiss-sdi.ch | Xavier Bays, Data Scientist @ www.swiss-sdi.ch | Tim Breitenbach, Analytics & Data Architect @ www.axpo.ch | Pradip Ravichandran, Computer Science @ www.fhnw.ch | Thilo Weber, Data Scientist @ www.geoimpact.ch | David Suter, Sustainable Energy Specialist @ www.geoimpact.ch
Dashboard Sreenshots
findings
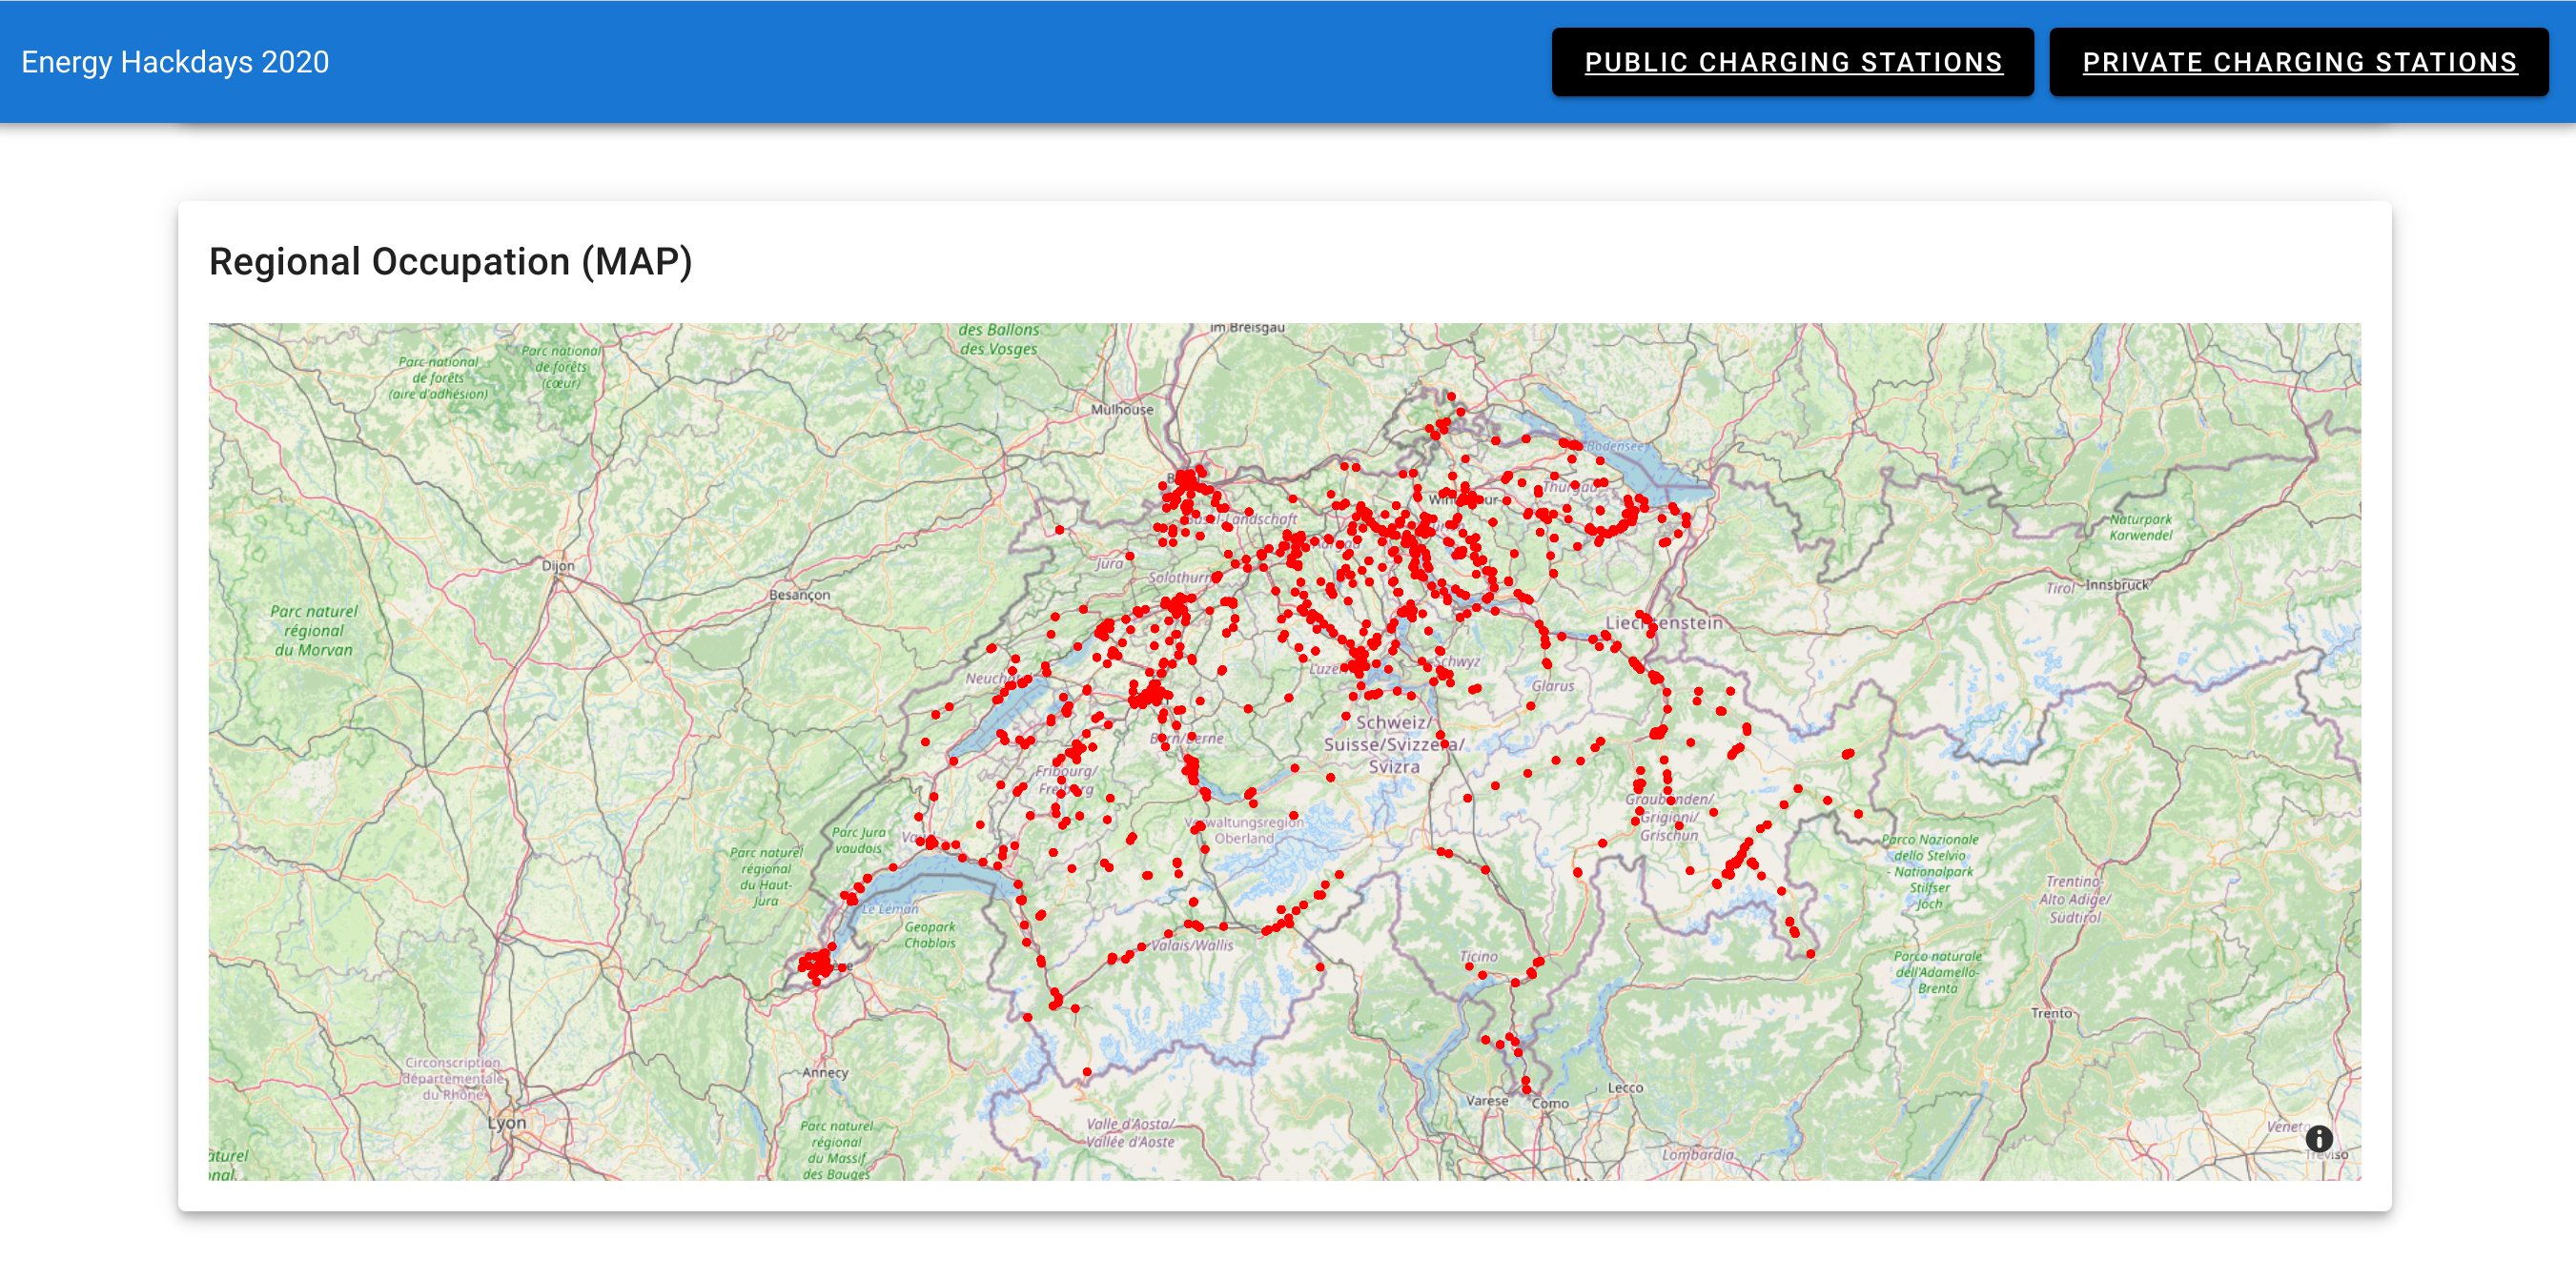
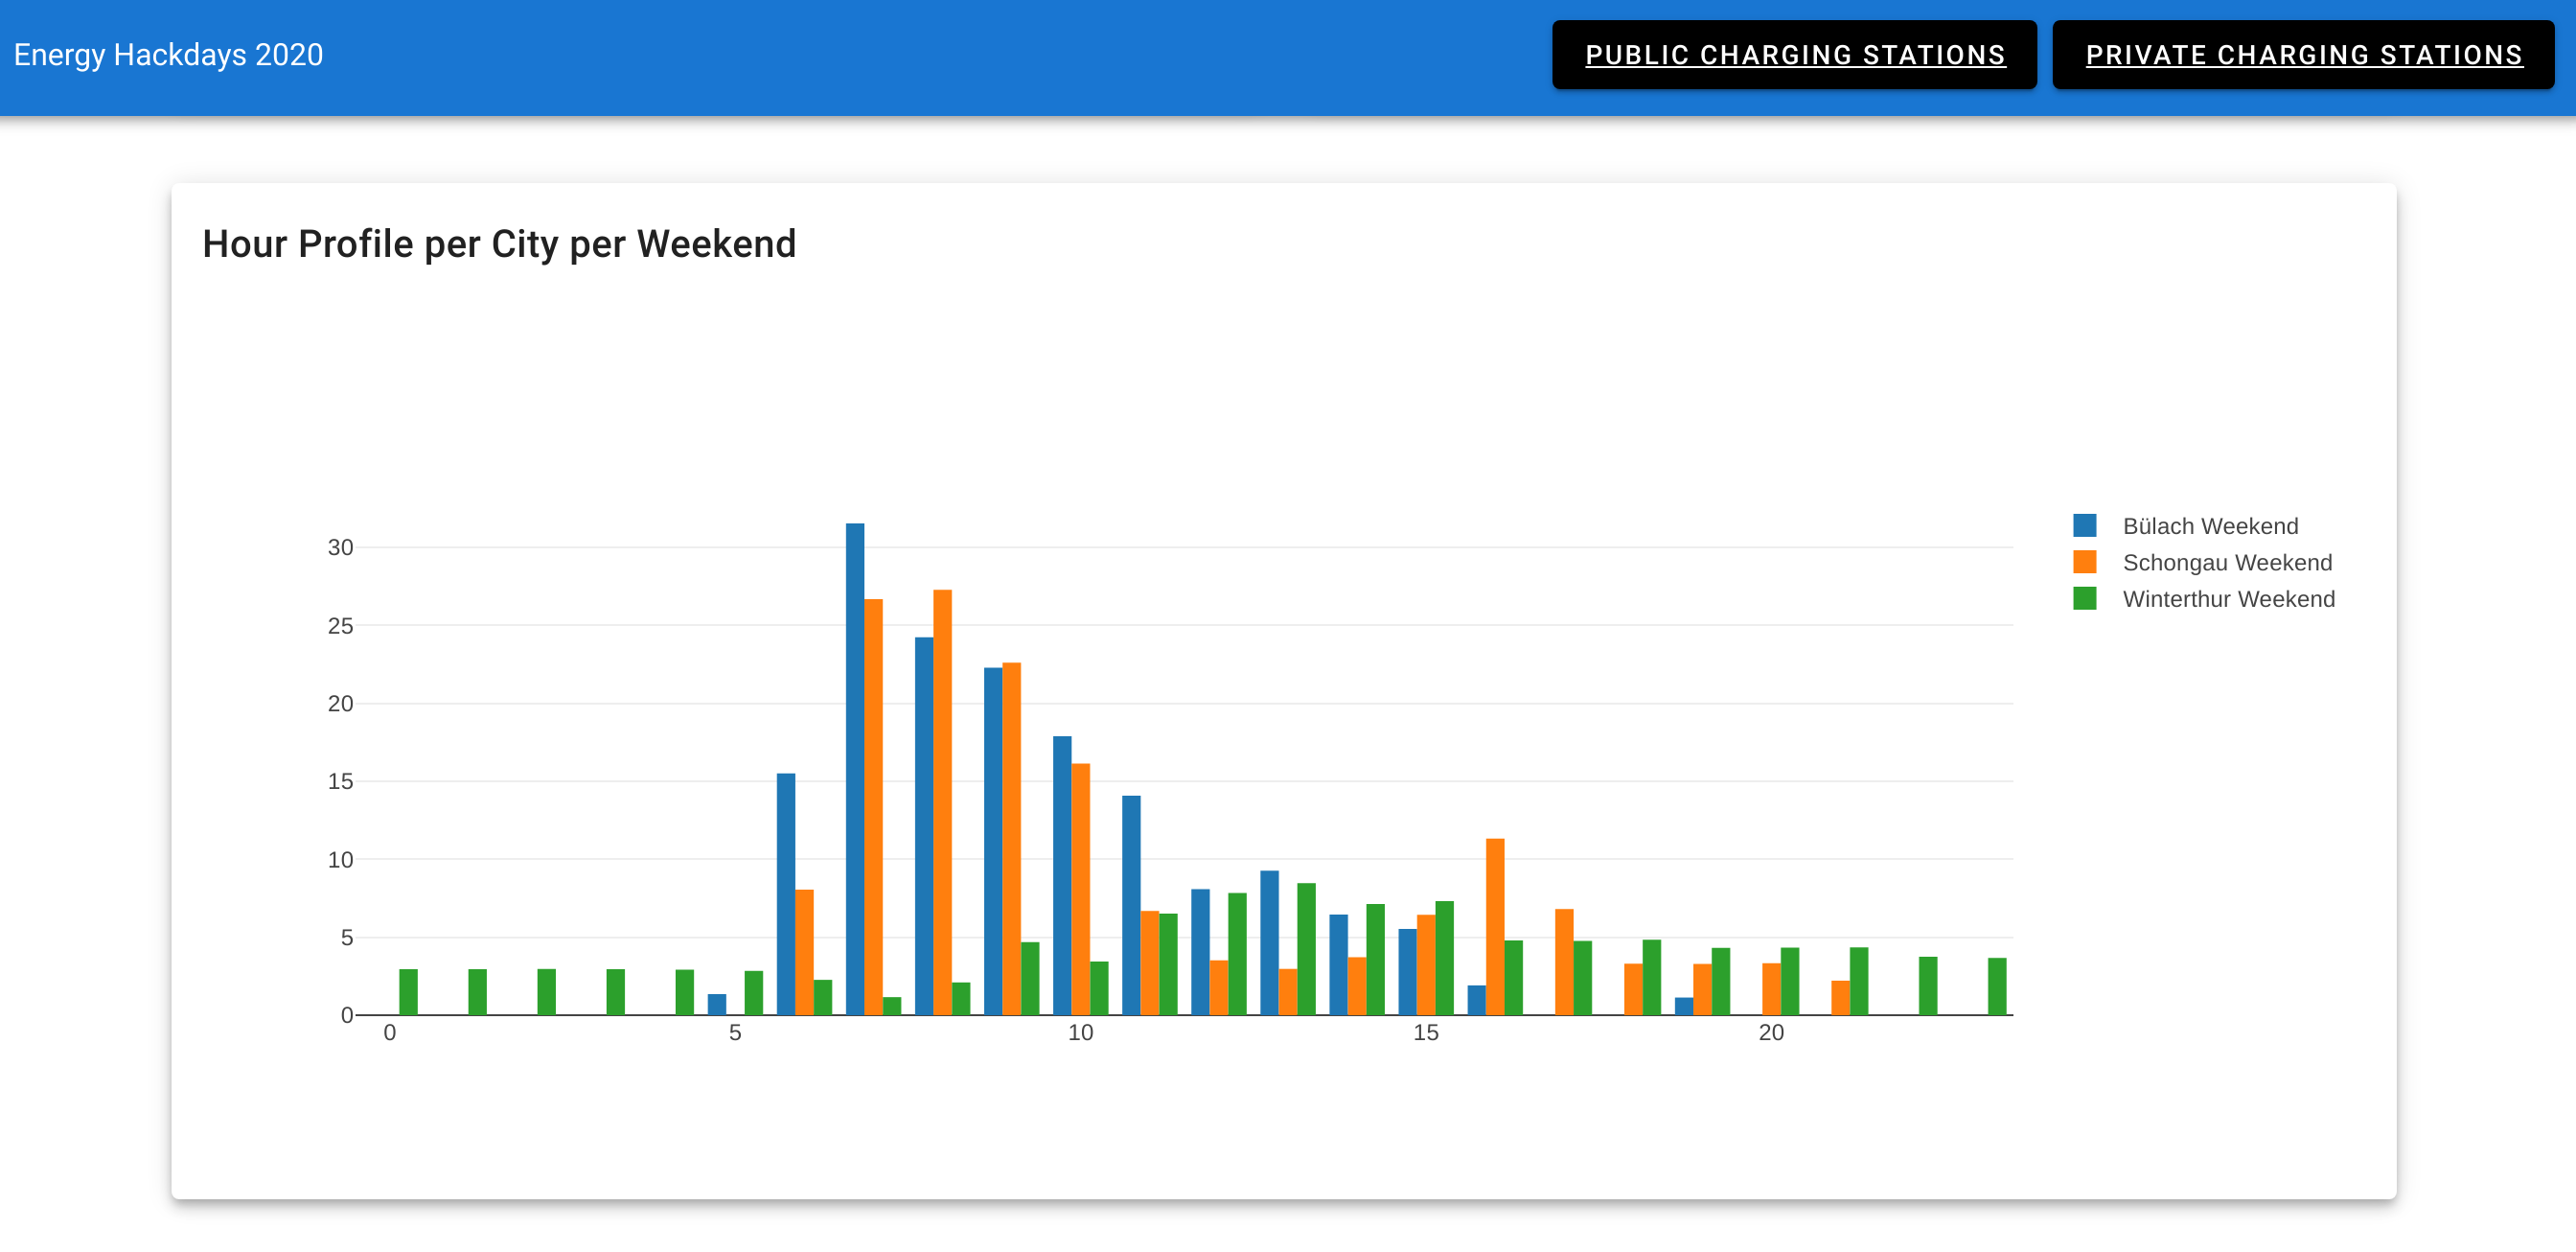
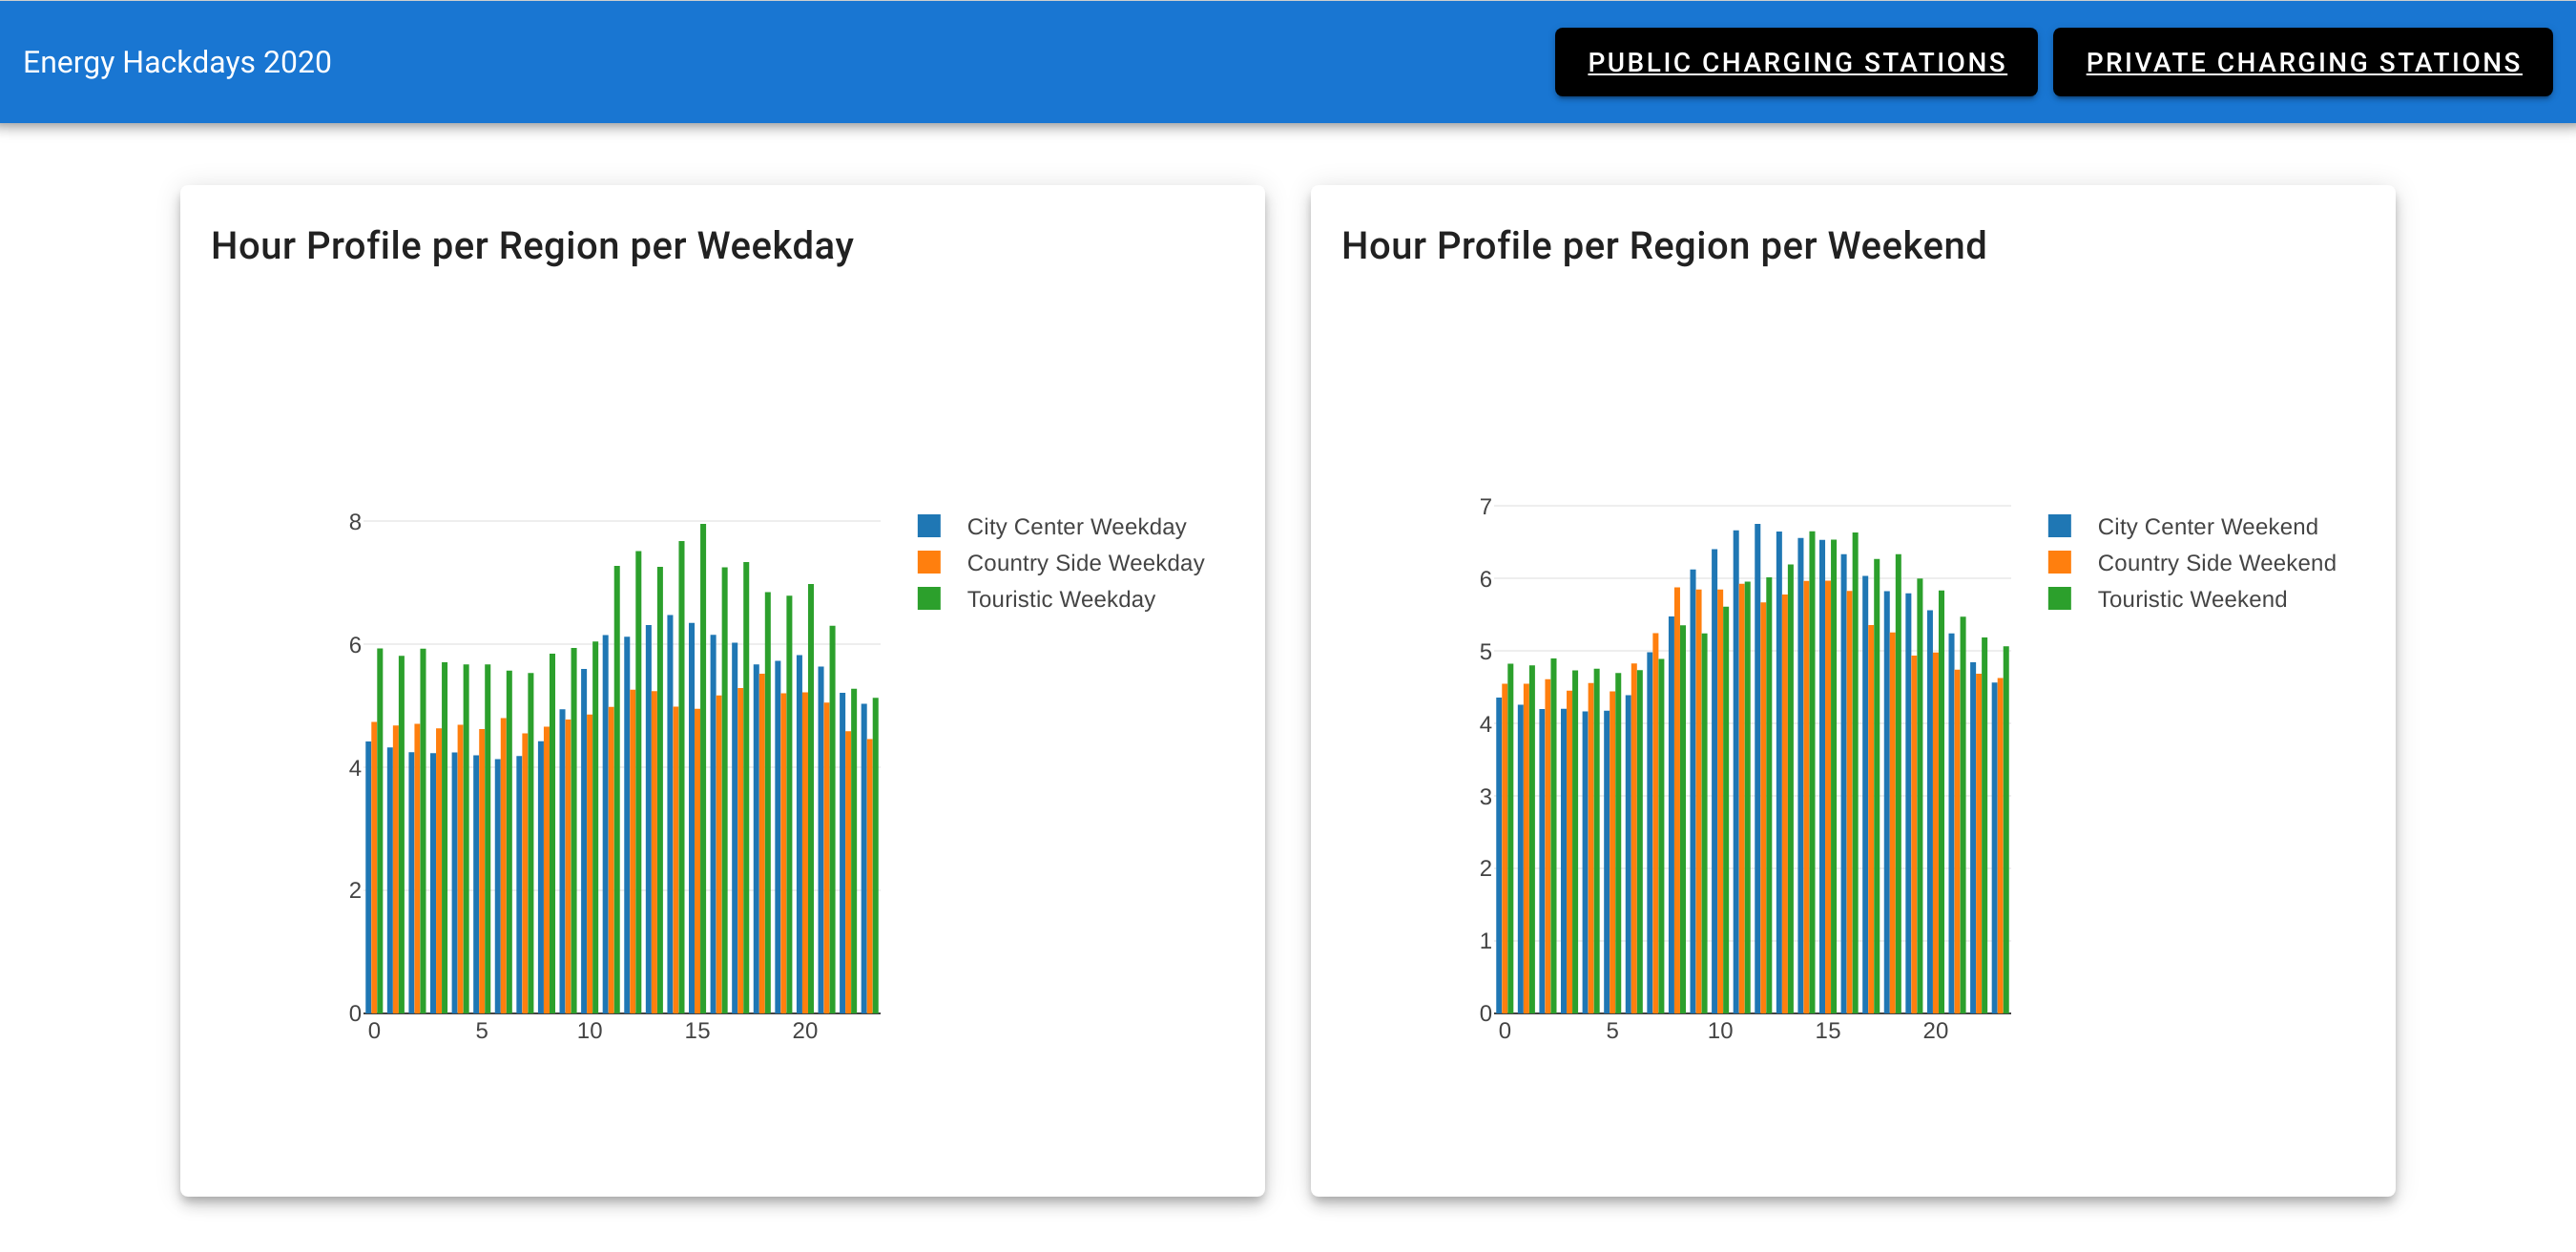
public ev charging station
- Typology of municipalities is an important feature for occupied ratio
- highest occupied ratio in big centers and peri-urban rural communes
- no correlation between population density and occupied ratio
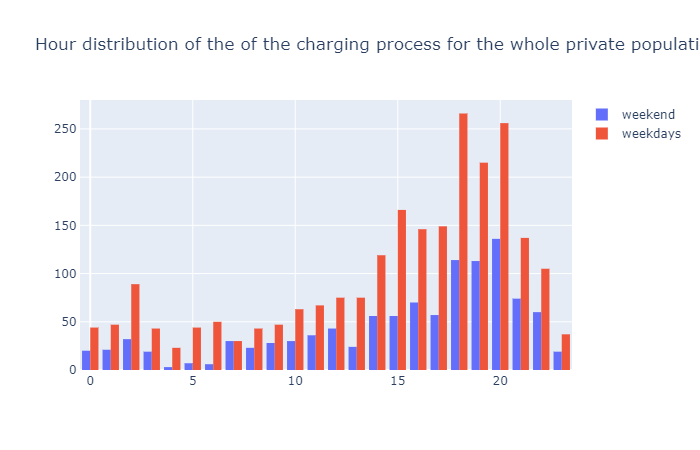
- different patterns on weekdays and weekends
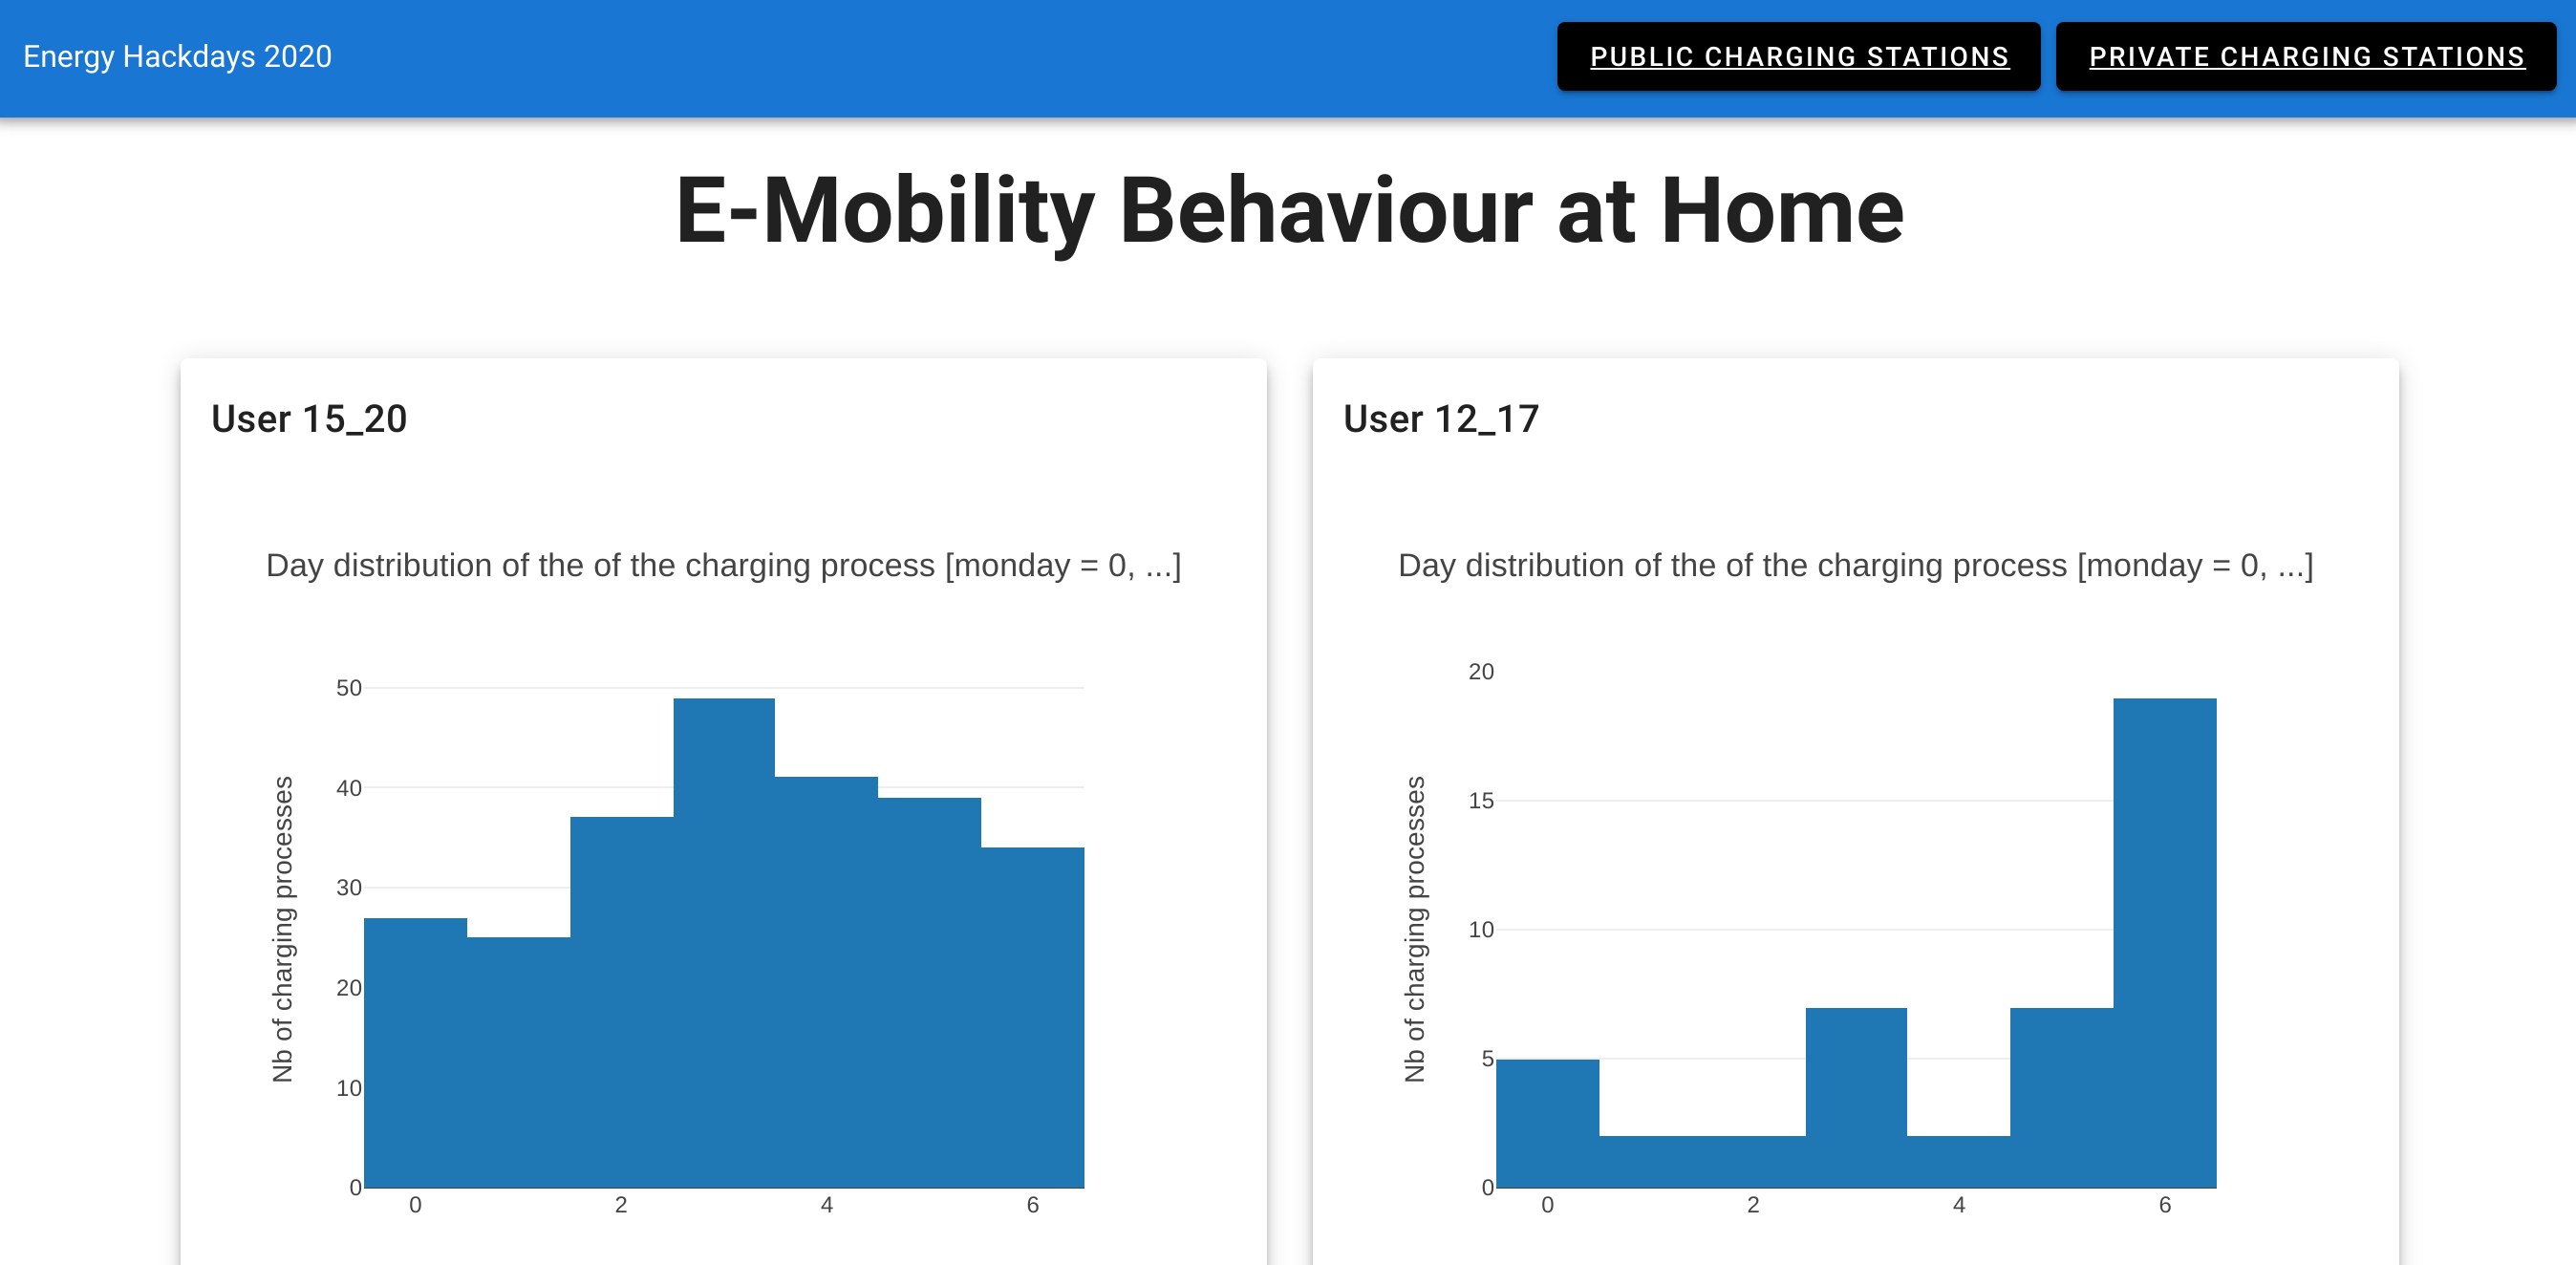
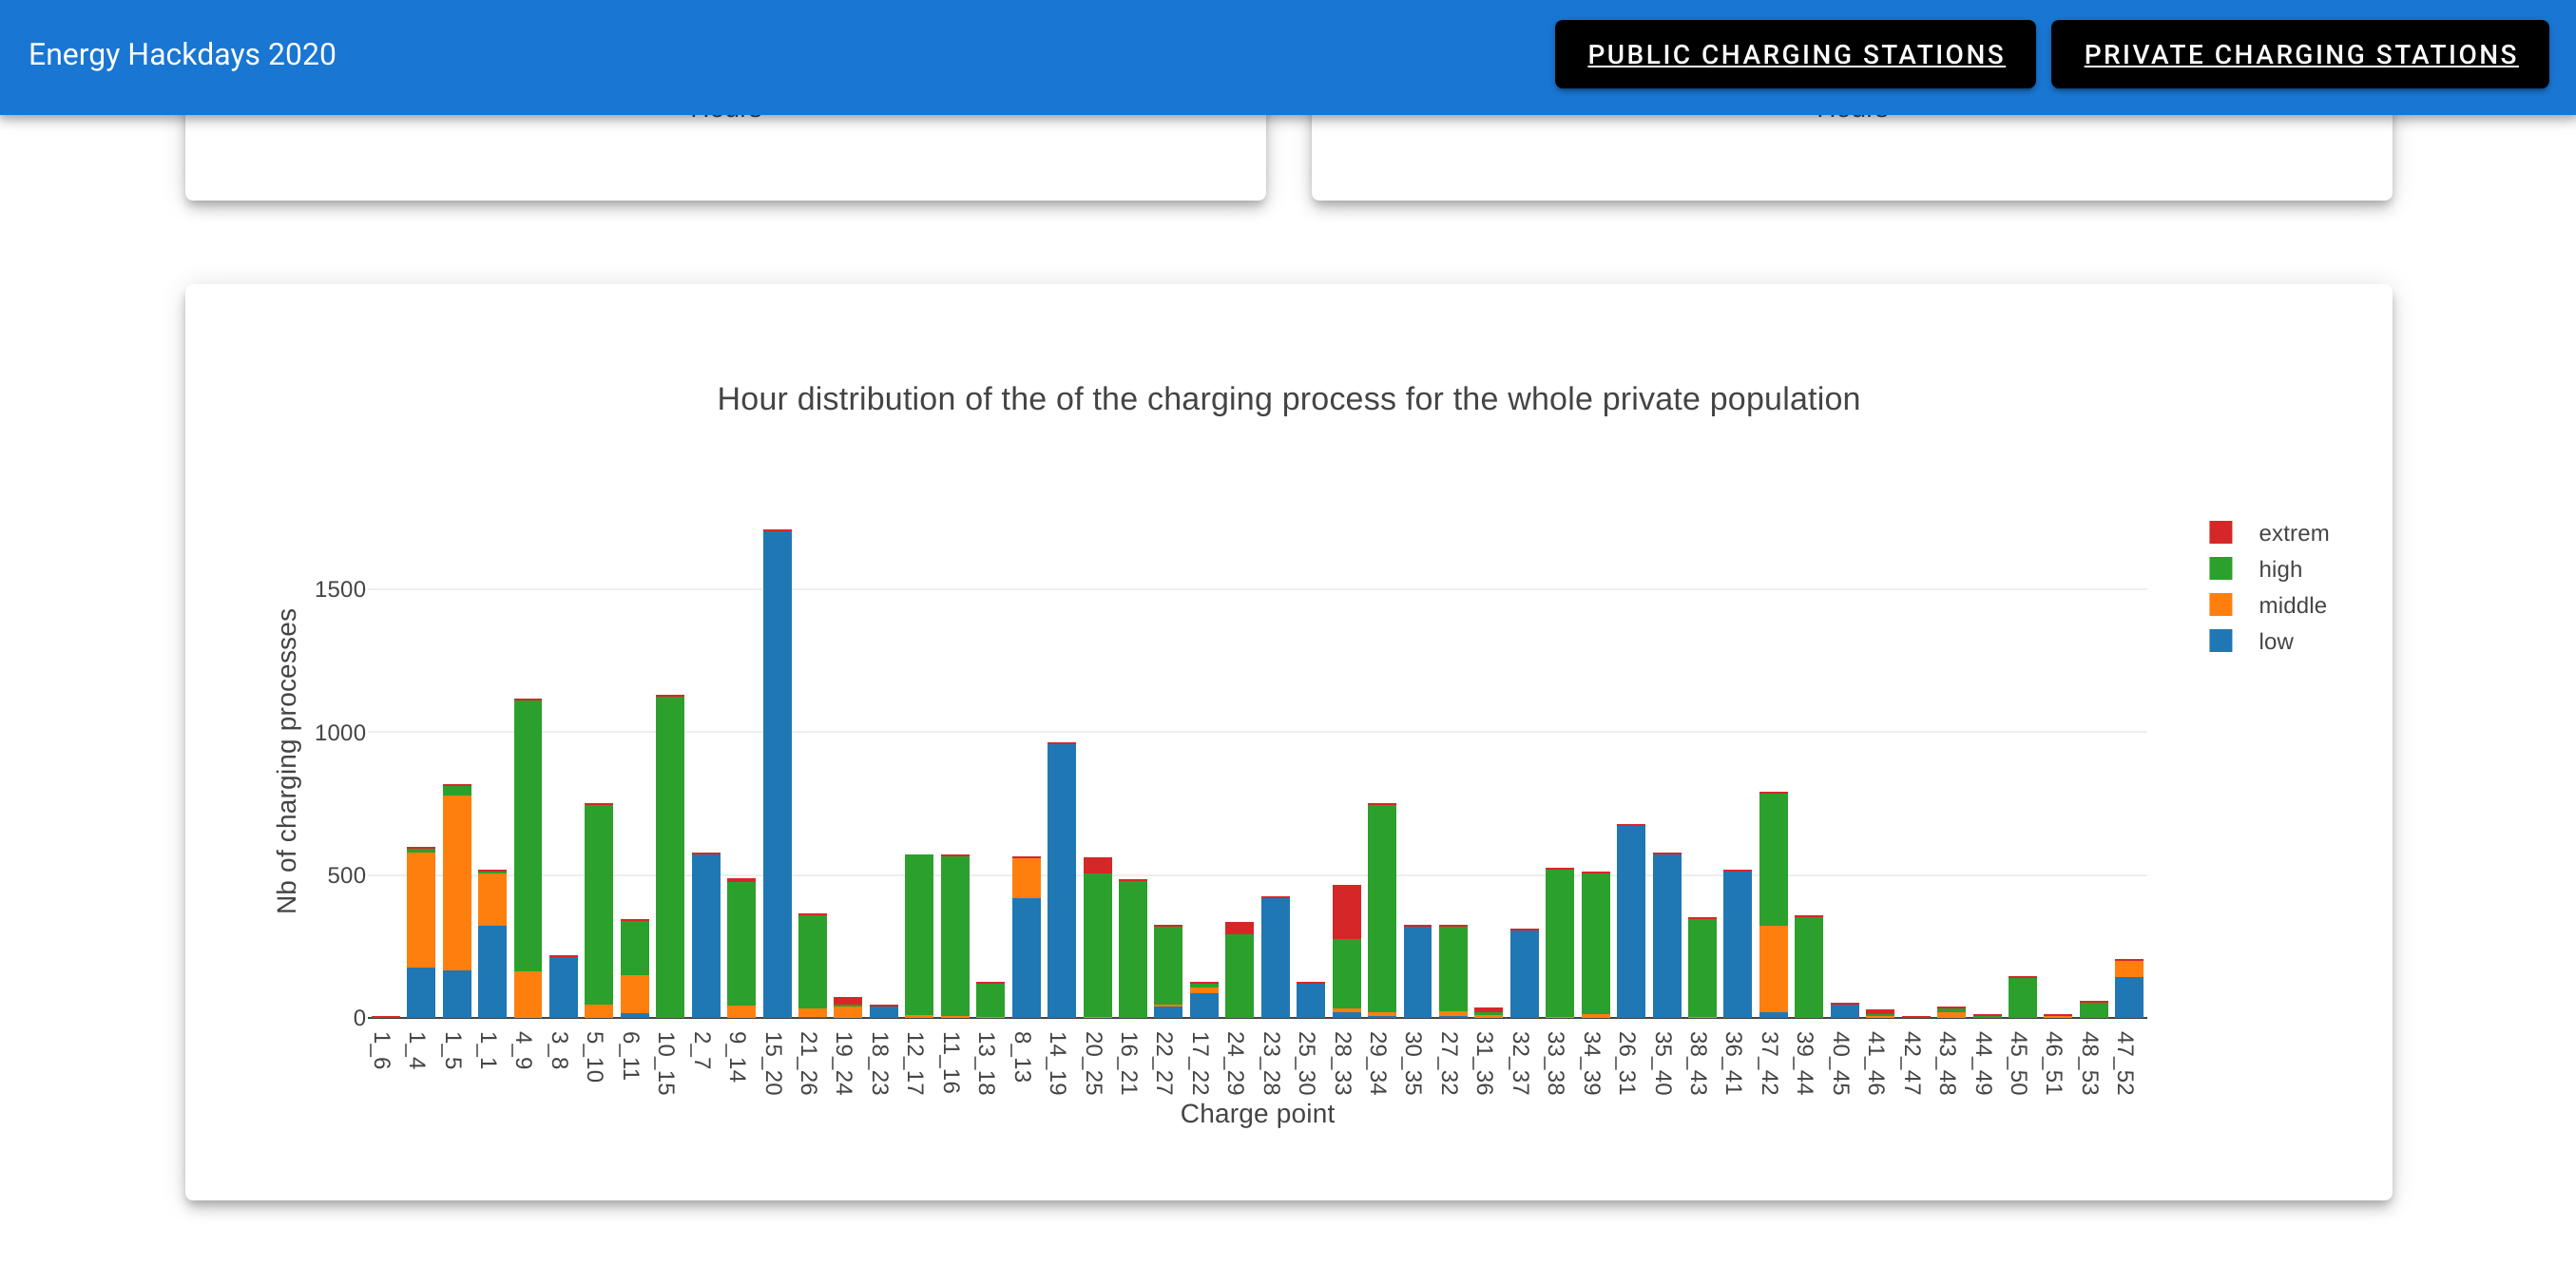
private ev charging station
Different charging patterns of private customers:
- Charging needs
- Hours of charging
- Week days of charging
This provide good hints for a further automated customer segmentation.
comparison of privat & public charging behavior
- different time-profile on weekdays and weekend in public, but not in private
possible next steps
public ev charging station
- occupation forecast for every charging station (hourly based day profile as a new feature for the website www.ich-tanke-strom.ch ) --> for the customers
- clustering with more location-based data (socio-economic, roads, traffic etc.), understanding of different charging patterns --> for the provider
- compare clusters of charging behavior with pv potential and production profiles, possibility of own consumption of charging stations --> for the grid
private ev charging station
- automated customer segmentation based on linked information (building data, socio-economoic data, location) --> for the provider
- cost estimation tool for customer --> for the customer
- prediction of behavior changes for the load-curve --> for the grid
faced challenges
- parsing and structuring provided raw data --> long running tasks
- handling data errors and missing data
things to do
- run everything on database server
- productionalize frontend to shoot queries onto database and parse them to json
Data Engineering
Architecture Overview
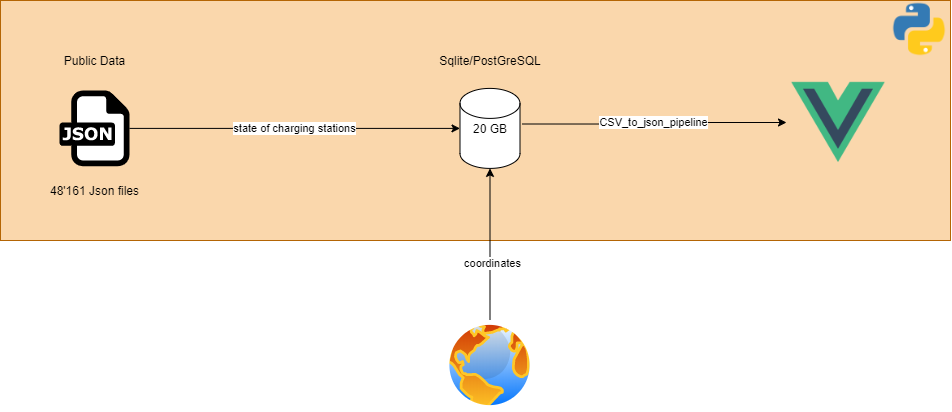 data_engineering_diemo/data_eng_architecture.png
Data Structure of diemo jsons
- EVSEStatuses
- OperatorID
- Operatorname
- EVSEStatusRecord
- EVSEID
- EVSEStatus
Python and SQL part
For parsing the 48'000 json files in 5 minutes resolution for 6 months we used python scripts. We had to implement various exceptions because of empty jsons.
First we tried looping everything into csv, which did not perform as fast as we would like. We then tried Apache Feather as a data transfer format but the data storage speed wasn't the problem. The next try was a sqlite database which works fine and was an okay solution for the hackathon. If the project would go live, we would recommend a database server preferably in the cloud, to get the inital data loading done quick. The dataload still takes over 10 hours and is not very efficient.
SQL Queries
The first query is about getting an overlook over all the EV-Charging points, the different operators.
Visualisation ideas
public ev charging stations
- snapshot for specific time (occupied, available) on a map
- top 3 utilised stations for each canton on a map
- occupation ratio per station on a map
- time-profile clusters --> which stations have the same time-profile
- time-profile in city centers, countryside and touristic regions
- aggregated occupation over time of a day/week for all stations
- occupation over time of a day/week for a selected station
- typically duration of a charging process on a map
Analyses
Charging points utilization
Features analysis:
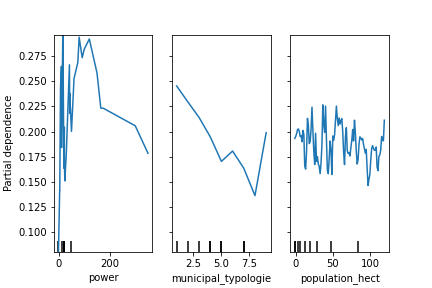
Legend:
1 | Grosszentren
2 | Nebenzentren der Grosszentren
3 | Gürtel der Grosszentren
4 | Mittelzentren
5 | Gürtel der Mittelzentren
6 | Kleinzentren
7 | Periurbane ländliche Gemeinden
8 | Agrargemeinden
9 | Touristische Gemeinden
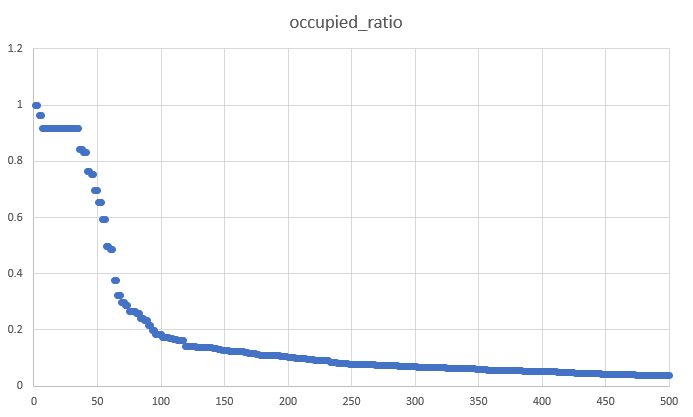
Occupied ration distribution:
Weekend VS weekdays behaviour for private customers: hourly consumption:
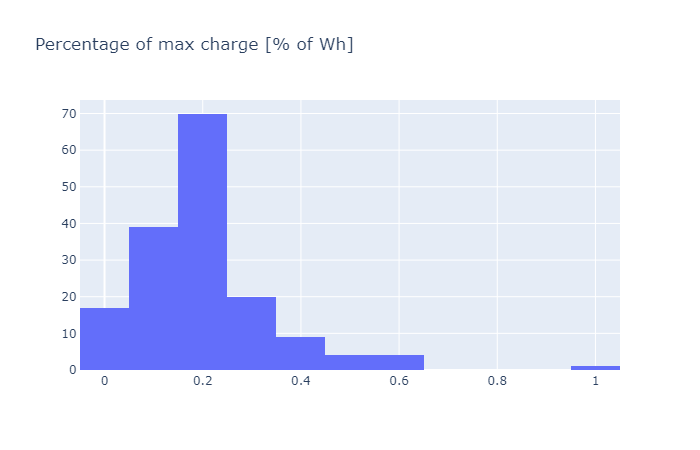
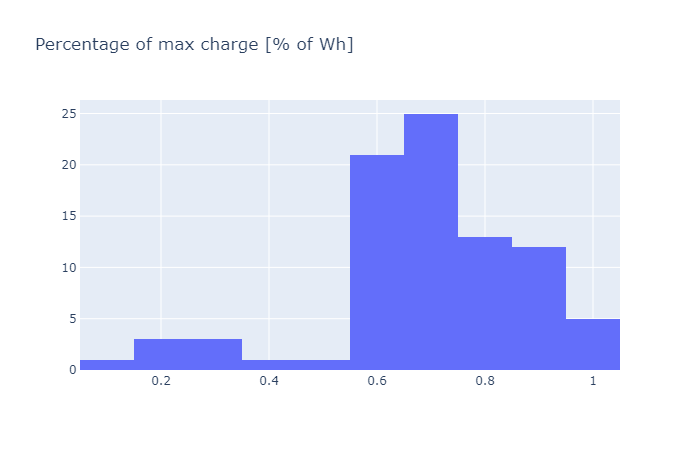
Example of behaviour differences between two private customers: Distribution of the percentage of the whole battery that is charged.
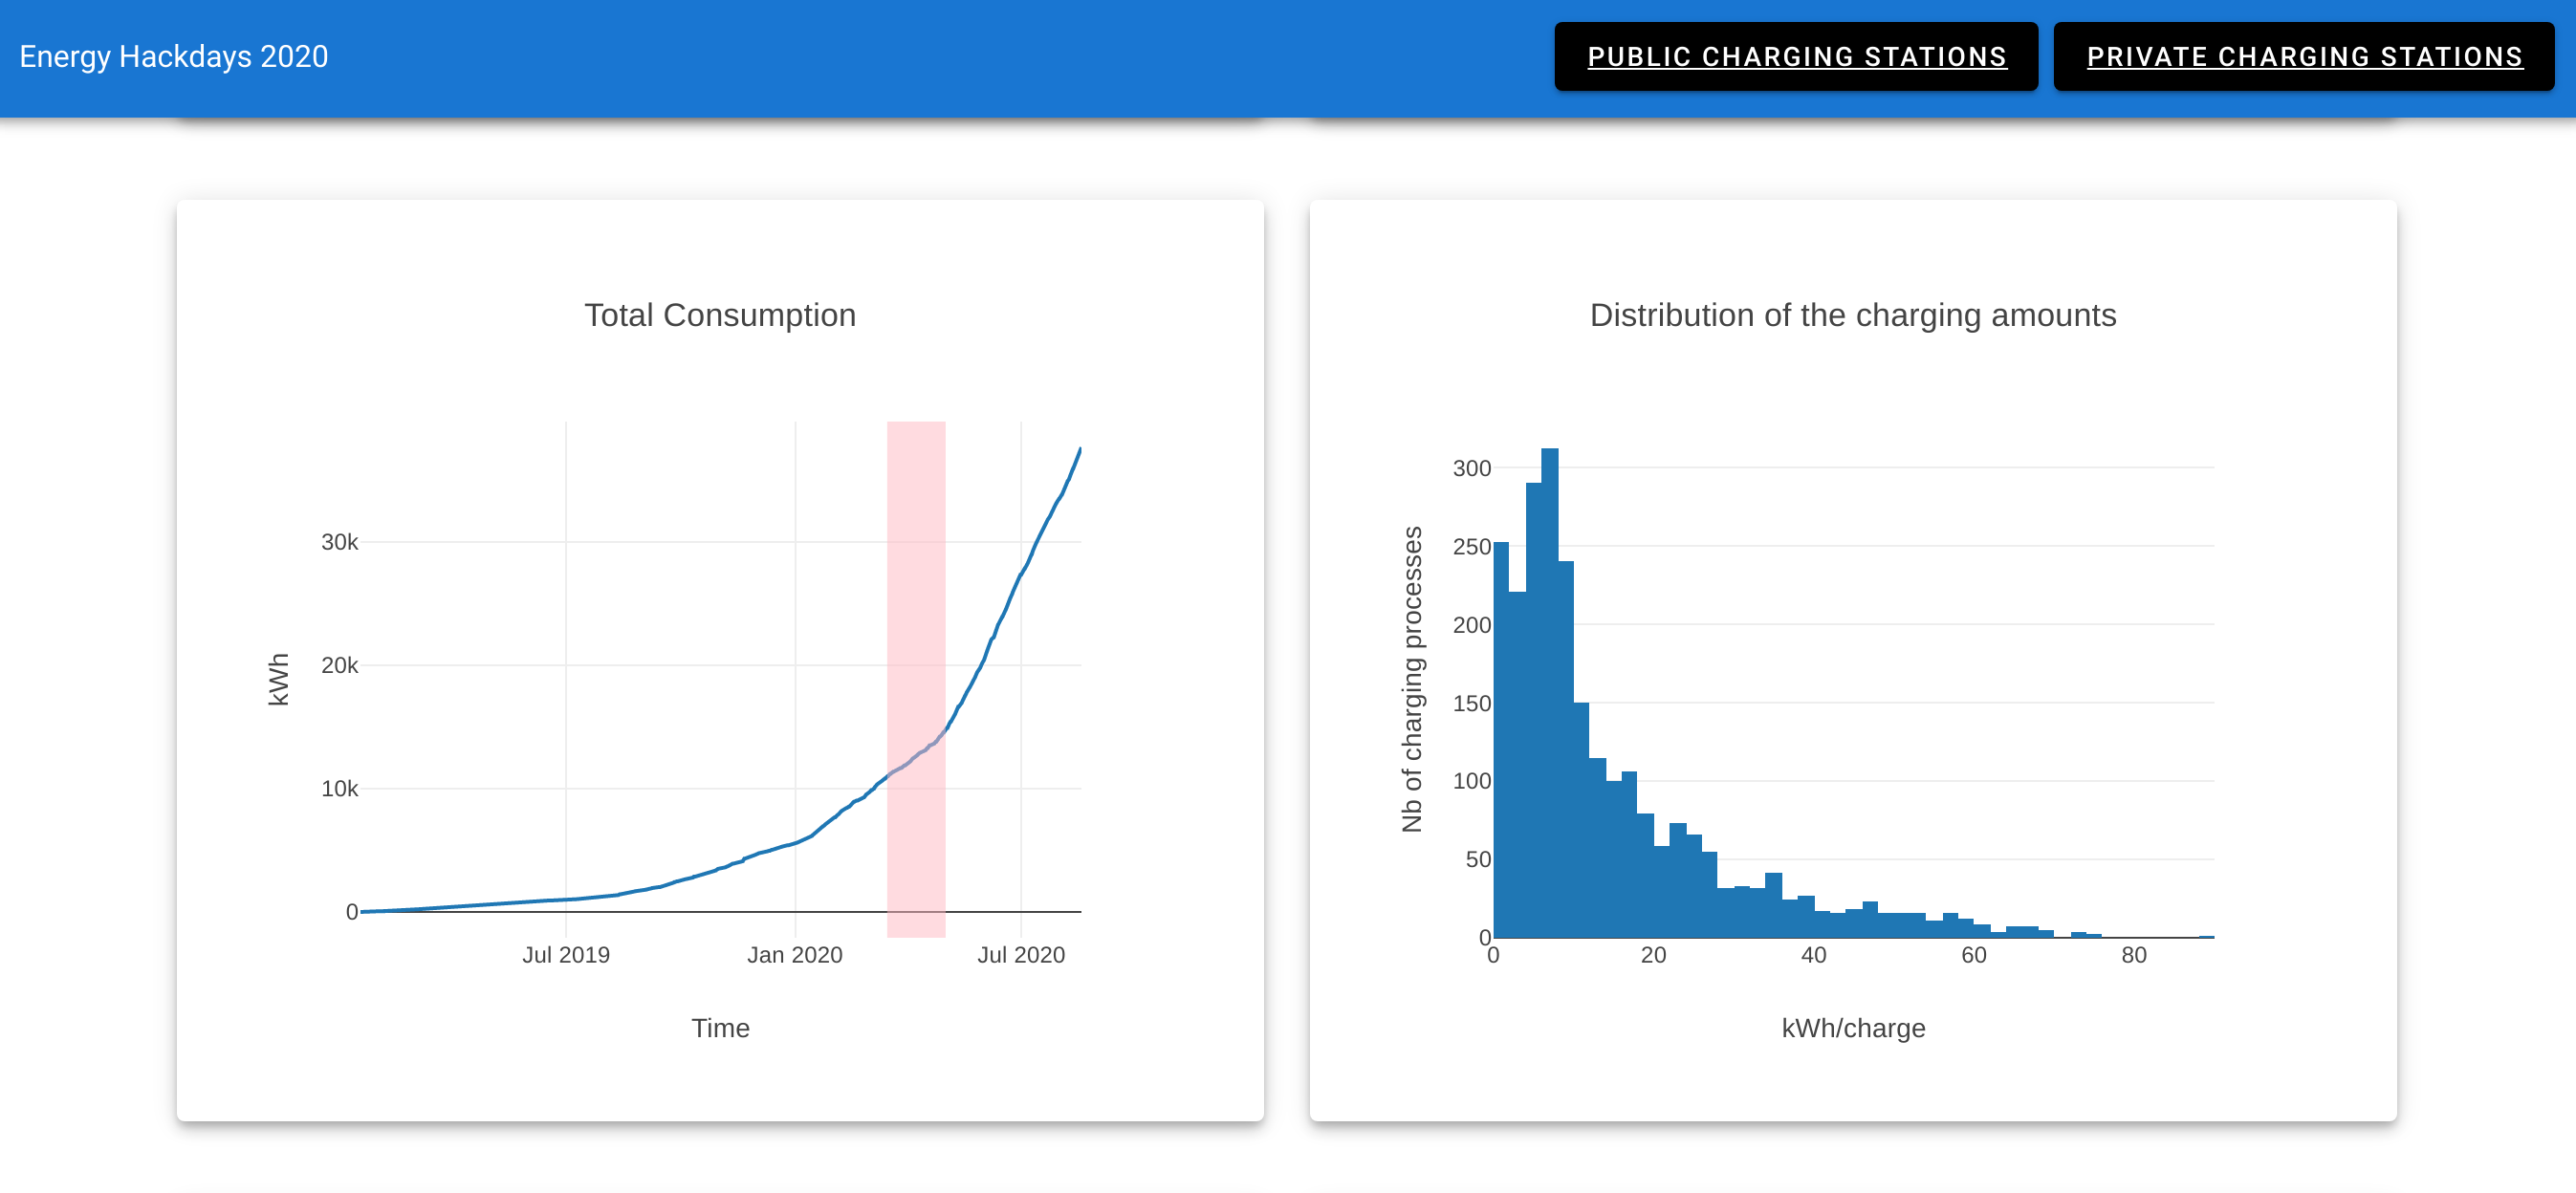
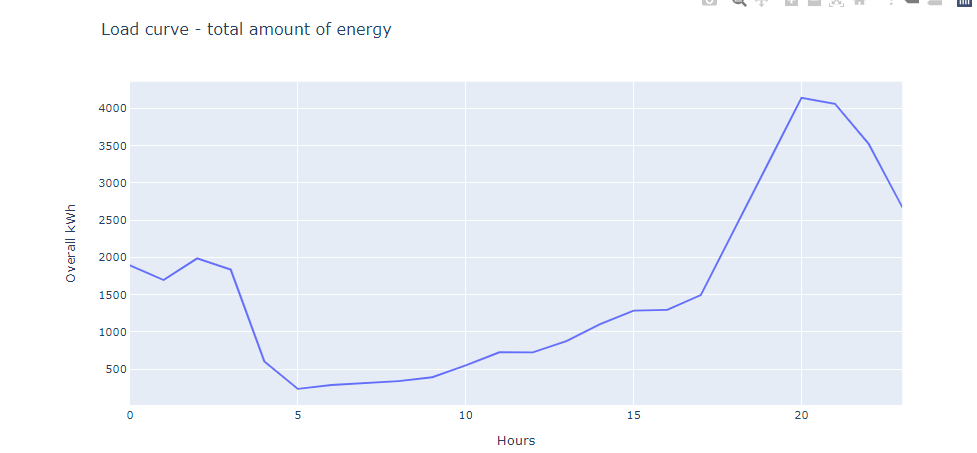
Load curve for private customers:
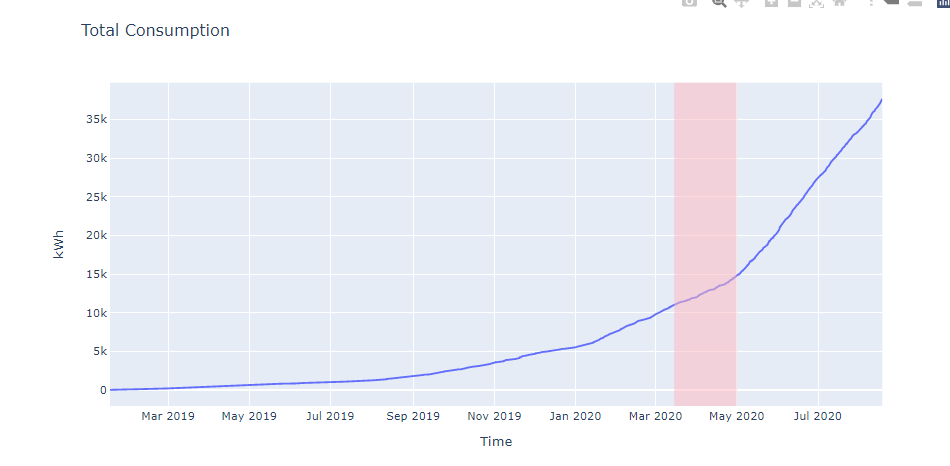
Overall energy consumption by private e-cars. This also show the adoption curve. The red zone corresponds to COVID time.
Empower the People with Smart Meter Data
(Challenge #7)
Novel energy certificate assesses where and how strongly building / user behaviour causes deviation from theoretical/optimum behaviour.
💭 What problem are you solving?
Empowering people to understand what they can do to take action against climate change.
💡 How are you solving that problem?
Monitoring of people’s energy consumption, with the implementation of a rating system to understand how good they and the building they are living in are. Personalized information about what they can do to improve themselves is then presented. For example: for additional x Fr./month, get 100% electricity from renewable sources and move to category A.
🗽 What have you achieved during the Hackdays?
A new business concept for smart meter data.
📮 Include links to source code or prototypes.
📎 Indicate any relevant terms or licenses on your work.
Live or frequently updated and historic smart meter data.
🎢 What issues have you encountered, for example in regards to the data you wanted to use?
Choosing the most impactful customer, addressing the exact issue which is tackled by our solution. Data will most probably not come from one unique source, but from a variety of sources. The users should authorize data hosters to use their data.
💹 Which data have you used? Format…? Permissions?
Finding business partners, implementing the new certificate, and build a solid user base.- Federal office of energy/statistics (public data),
- VSE Homepage (public data)
- Customer segmentation data from City Energy Provider of St. Gallen (confidential)
- Smart meters data (from public utilities)
- Building characteristics (from Building and Dwelling register)
- Weather data
🗻 What are the next steps?
Finding business partners, implementing the new certificate, and build a solid user base.
💁 Who are you and your team mates, and how can you best be contacted?
Clara Esteve, Jeremias Rehn, Philipp Schütz, Wim Ton, Holger Wache
29.08.2020 12:36 Initial project release
Energy data visualization
Energy data are diverse. How do we present them interactively and informatively?
Big picture: (Challenge #6)
Integrated Energy System models produce a large amount of results, with a wealth of information. There need to be interactive tools to explore this data by drilling down the data sets.
Idea:
Based on databases containing the results, a concept for the visualisation (including data plots/charts) as well as the actual implementation with modern and open-source web publishing and programming tools has to be implemented. It might also be used to display input parameters.
We provide:
- Our knowledge and help
- Flexibility to choose a focus
- Clearly defined questions
- Cleaned and structured data
- Established Python-based framework
- Opportunity to see your idea in production soon
We expect:
Your creativity!
Current framework:
(not restrictive):
- Python
- Plotly
- CSV
29.08.2020 09:07
New landing Page with Scenario overview
UI Improvements:
- Dynamic triggered graphs.
- Immediate trigger of Graph plot on change of parameters or scenario
- Moving Scenario Tabs to center page
29.08.2020 12:42
Prototype finished - ready for presentation.
LocationAI
Know the neighbourhood of your customer
Note: demo works however only for the Germany Nord Rhein Westfallia (Cologne, Dusseldorf, Munster and so on)
Challenge
Kundensegmentierung/-Analyse auf Basis offener Daten vs Daten eines Energieversorgungsunternehmens. Beispiele haben bereits gezeigt, dass eine Kundenanalyse/Kundensegmentierung auf Basis offener Daten bereits möglich ist und es keine Kundendaten mehr benötigt. Ist dem so und wenn ja, wie sieht es aus?
ML Wind Power-Prediction
Ziel: (Challenge #8)
- Entwicklung von Machine Learning-Algorithmen (oder Tools/Apps) für verbesserte standortspezifische Leistungsprognosen von Windenergieanlagen.
- Entwicklung von alternativen Algorithmen z.B. Artificial Neural Networks
##Idee: Die genaue Vorhersage der Stromproduktion einer Windkraftanlage an einem bestimmten Standort ist sowohl in der Planungs- als auch in der Betriebsphase wichtig, aber die standardmäßige Methode zur Speicherung von Leistungskurven ist nicht spezifisch für die atmosphärischen Bedingungen am Standort und kann daher ungenau sein. Das Ziel dieser Herausforderung ist die Entwicklung eines Algorithmus für maschinelles Lernen, um die Genauigkeit der standortspezifischen Leistungskurvenvorhersage zu verbessern. Dazu wird Ihnen ein Datensatz von 8'000 simulierten Leistungen der NREL 5MW-Referenzwindturbine aus dem Simulationswerkzeug ASHES bei verschiedenen atmosphärischen Bedingungen zur Verfügung gestellt. Dieser neue Algorithmus könnte in einem zukünftigen Innovationsprojekt zu einem Werkzeug für Windparkbetreiber entwickelt werden.
##Daten:
- Ein Datensatz von 8'000 simulierten Leistungen der NREL 5MW-Referenzwindturbine aus dem Simulationswerkzeug ASHES bei verschiedenen atmosphärischen Bedingungen wird zur Verfügung gestellt.
#Machine Learning Wind Turbine Power Curve Prediction
Goal:
- Development of machine learning algorithms (or tools/aps) for improved site-specific performance prediction of wind turbines.
- Development of alternative algorithms e.g. Artificial Neural Networks
Idea:
The accurate prediction of the power production of a wind turbine at a particular site is important in both the planning and operation phases, but the standard power curve binning method is not specific to the atmospheric conditions at the site and can therefore be inaccurate. The goal of this challenge is to develop a machine learning algorithm in order to improve site-specific power curve prediction accuracy.
This new algorithm could be developed into a tool for wind farm operators in a future innovation project.
##Data For this challenge, you will be provided with a dataset of 8'000 simulated powers of the NREL 5MW reference wind turbine from the simulation tool ASHES at a range of different atmospheric conditions.
Download data here: https://github.com/sarah-barber/powercurve/tree/master
29.08.2020 10:54 Project updated
Optimization of District Heating
Energieverbrauch von Fernwärmeanlagen minimieren, insb. der Einsatz von Spitzenlast-Kesseln (fossile Brennstoffen)
Challenge #1
Optimierung von Fernwärmeverbünden
Herausforderung - Challenge
[DE]
Heizen macht über 40% des schweizerischen Energie-Endverbrauchs aus. Fernwärmeverbünde ermöglichen das Ausrollen von Wärme auf Basis erneuerbarer Energien; sie sind ein wesentlicher Bestandteil der Energiestrategie 2050.
Die AEW als Betreiber von mehr als 80 Fernwärmeverbünden sieht durch diese Challenge eine sehr gute Möglichkeit der Replizierbarkeit.
Ziele
- Energieverbrauch von Fernwärme-Zentralen allgemein minimieren (Primärenergieeinsatz).
- Einsatz von Spitzenlast-Kesseln minimieren. Typischerweise verwenden diese Kessel fossilen Brennstoffen, während der Haupt-Kessel erneuerbare Energien verwendet.
Lösungsansatz
- Lastprognosen auf Basis von historischen Verbrauchsdaten, Wetterdaten, etc projizieren.
- Leistungs-Scheduling innerhalb des Verbundes unter Ausnutzung der thermischen Masse der belieferten Objekte oder Einsatz von verteilten kleineren Zwischenspeichern.
[EN]
Heating accounts for more than 40% of Switzerland’s final energy consumption. District heating networks facilitate deploying renewable heating on scale and are an essential part of Switzerland's Energy Strategy 2050.
AEW as operator of more than 80 district heating networks sees a very good opportunity for replicability for this challenge.
Goals
- Minimize the energy consumption of disctrict heating plants (primary energy use)
- Minimize the use of peak load boilers. These boilers typically use fossil fuels, while the main boiler uses an renewable energy source.
Solution
- Load forecasts based on historical consumption data, weather data, etc.
- Performance scheduling within the network by exploiting the thermal mass of the supplied objects or using distributed smaller intermediate storage facilities.
Prototyp
Anforderungen
Allgemein:
- Für wen: Steuerungssystem einer Fernwärmeanlage, die von einem erneuerbaren Energiequelle (z.B. Holzkessel) betrieben wird, sowie zusätzlich bei Bedarf einen oder mehrere fossile Kessel (z.B. Gas).
- Was: Eine Prognose der benötigten Gesamtleistung (in kW) für jede Stunde der nächsten 24h, abhängig von der meteoroligischer Prognose für die Aussentemperatur und weiteren relevanten Parametern".
- Wieso: Damit das Steuerungssystem 1) möglichst wenig Energie insgesamt verbraucht, und 2) auf den Einsatz der fossilen Quellen verzichten kann. Das Ziel ist, dass möglichst nur das Zusammenspiel des Holzkessels und des Speichers (eine Art grosser Boiler) benötigt werden, um die Wärmebedürfnisse zu decken
Detailliert:
1. Als AEW möchten wir wissen, wieviel kW/h an Gaskessel-produzierte Wärme wir pro Jahr durch die Leistungsprognose hätten sparen können, um zu entscheiden ob es einen bedeutenden Einfluss auf die Klimaziele hätte.
--> TO DO
2. Als Betriebsingenieur brauche ich eine Prognose der benötigten Gesamtleistung (in kW) für jede Stunde der nächsten 24h, damit ich sie visualisieren kann.
--> IN PROGRESS: Ansätze und erste Prognosen DONE, Optimierung und Komplettierung relevante Input-Variablen TO DO
3. Als Data Scientist will ich wissen, welche Wetter-Faktoren aufgrund der historischen Daten die benötigte Gesamtleistung (in kW) beteutend beinflussen (z.B. neben der Aussentemperatur auch die globale Strahlung, Windstärke, Luftfeuchtigkeit,...), damit ich die richtigen Input-Daten für die Prognose wähle
--> IN PROGRESS
4. Als Data Scientist will ich die fixe Betriebszeiten von Kunden-Boilers aus Verbrauchsdaten erkennen, damit ich diesen Input der Leistungs-Prognose hinzufügen kann
--> DONE: Included in load forecast
Results
Download the final presentation (pptx) for an overview of the results achieved.
Datenquellen - Data sources
[DE]
- Verbrauchs- und Erzeugungsdaten eines Dorf-Fernwärmenetzes mit 9 Abnehmern: 2 Jahren (2018-2019), alle 5 Minuten
- Historische Wetterdaten für die Region
[EN]
- Production and usage data of an existing distric heating network for 9 client buildings: 2 years (2018-2019), every 5 minutes
- Historical weather data for the area
Team
- Toni Wietlisbach, AEW --> Fernwärme
- Andy Gubser --> Data science
- Martin Horeni --> Data Science
- Marvin Grass --> Data Science
- Wolfram Willuhn
- Emilie Boillat --> Dokumentation
Weitere Schritte - Next Steps
Integration ins Leitsystem
- Recommender: Speicher jetzt entladen oder füllen?
- Recommender: Wie viel Wärme soll der Holzkessel jetzt produzieren?
- Recommender: Soll der Ölkessel (Nr. 6) "abgeworfen" werden?
Weitere potentielle Datenquellen
- Kalenderdaten (Feiertage, Ferienzeit, …)
- Kenndaten/Modelldaten Fernwärmesysteme
- Geodaten (Fernwärmenetz, Wärmebedarf, Wärmequelle, …)
- HSLU Programm "Thermische Netze": seems relevant, but is out of date
- Statistics from Germany
Beschreibung Beispiel-Fernwärmeverbund
Ein Fernwärmeerzeuger kann an wenige bis zu 1000 Gebäude Wärme verteilen, je nach Grösse der Anlage. Die Wärmequelle kann z.B. eine Wärmepumpe, Kehrrichtverbrennungsanlage, oder ein Holzkessel sein.
In unserem Data Sample geht es um ein Dorf-Fernwärmeverbund mit 9 Kunden (darunter Gewerbe, Schulhaus, Gemeindehaus).

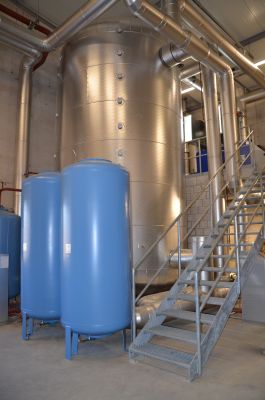
Heizzentrale
- Der Holzkessel produziert in der Regel die Wärme (kann auf ca 30%-100% seiner Kapazität laufen oder ausgeschaltet sein)
- Die zwei Gaskessel werden bei Bedarf eingeschlatet um eine Spitzenlast zu decken. Sie dienen auch als Redundanz, sollte der Holzkessel ausfallen.
- Der Speicher bekommt unten abgekühltes Wasser zurück aus dem Netz, oben warmes Wasser aus den Wärmeerzeugern. Er kann je nach Bedarf Wärme speichern oder abgeben. Er hat allerdings keine unbegrenzte Kapazität (also z.B muss der Holzkessel runterfahren, bevor der Speicher voll wird).
Daten:
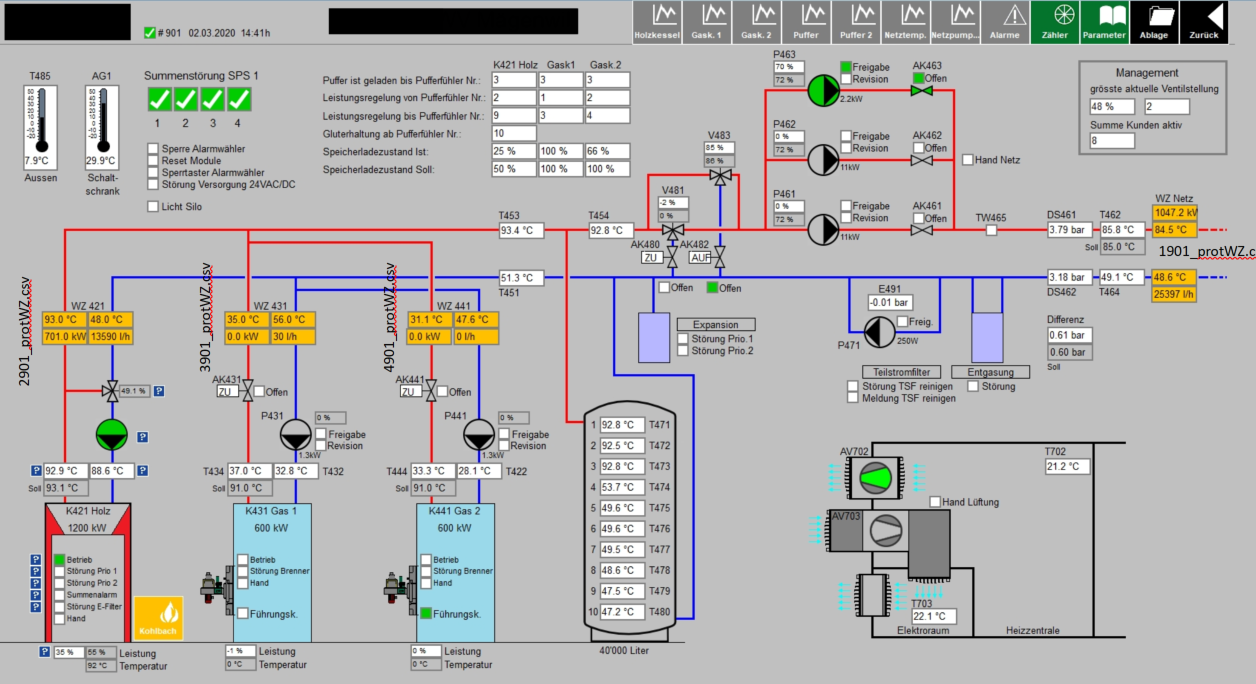
- Gelb markiert = Wärmezählerdaten (reine Messdaten)
- Weiss markiert = Leitsystemdaten (zur Steuerung)
- Grau markiert = Soll-daten vom Leistsystem (zur Steuerung)
Die Zieltemperraturen (Soll Gesamtzentrale z.B. 85.0°C, Soll Wärmekessel z.B. 93.1°C) werden gerechnet anhand der momentanen Aussentemperatur. Wärmekessel: auch gerechnet anhand der Aussentemperatur
Systemsteuerung:
Zur Zeit steuert das Leitsystem die Kessel und den Speicher aufgrund der momentanen Aussentemperaturen. Er "weiss" sozusagen nicht, was in einigen Stunden passiert.
Beispielsweise kann es in der Übergangszeit zu suboptimalen Spitzen kommen: am Nachmittag scheint die Sonne und der Holzkessel ist ausgeschaltet; der Speicher reicht nicht mehr um die kalte Nacht zu decken. Der Gaskessel wird eingeschlatet, obwohl der Holzkessel alleine hätte locker reichen können, wenn nachmittags mehr gespeichert worden wäre.
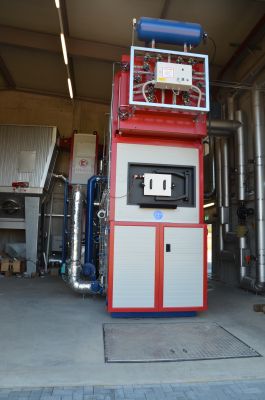
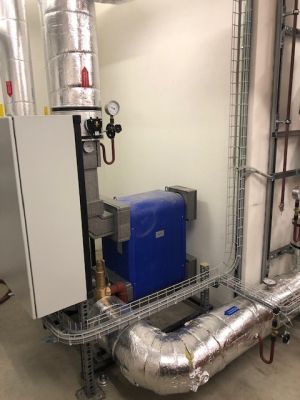
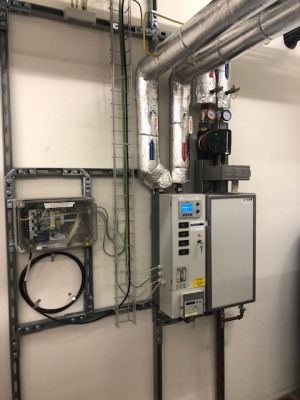
Von links nach rechts: Holzkessel, Speicher, grosse Wärmeübergabestation, kleine Wärmeübergabestation
Kunden
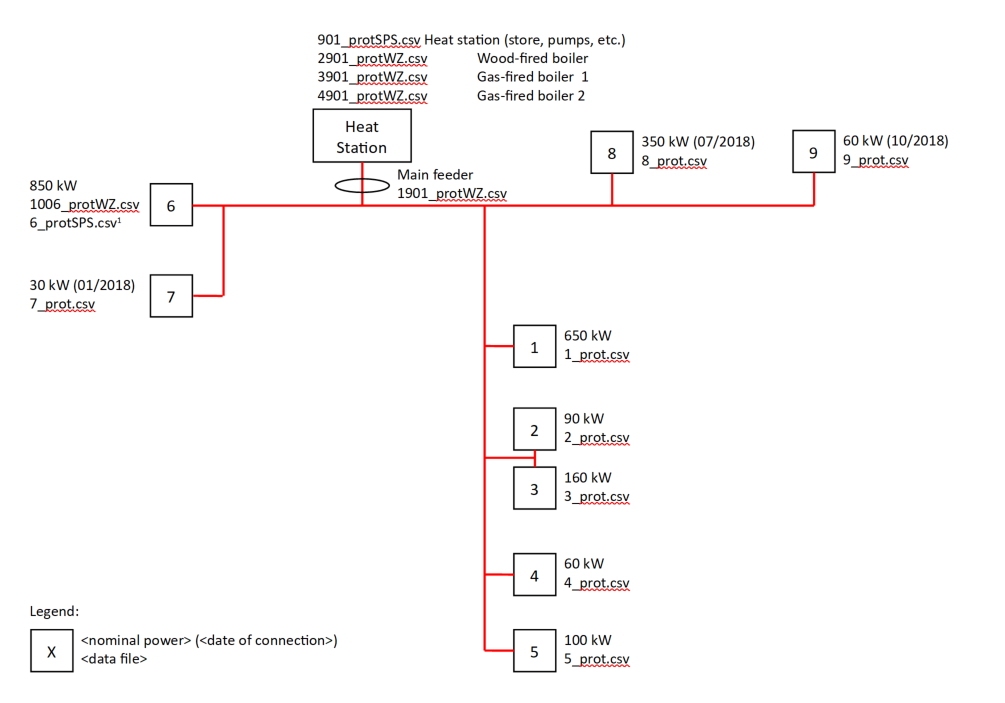
Auf dem Netzplan wird pro Kunde die maximale Leistung (in kW) angegeben.
Im Mittelland bedeutet diese maximale Leistung: wieviel Energie braucht es, um die Raumtemperatur auf 20°C zu heizen wenn die Aussentemperatur 8°C beträgt.
- Kunde Nr 1: Gewerbe
- Kunde Nr 2: Schulhaus
- Kunde Nr 3: Schulhaus
- Kunde Nr 4: Gemeindehaus
- Kunde Nr 5: Turnhalle / Mehrzweckhalle
- Kunde Nr 6: Gewerbe (Betrieb)
- Kunde Nr 7: Gewerbe (Büro)
- Kunde Nr 8: Gewerbe
- Kunde Nr 9: Gewerbe
Faktoren hinter den Wärme-Bedarf
- Aussentemperatur
- Zeiten, an denen die individuellen Boiler der Kunden angestellt werden. Normalerweise regelmässig. Kann man bedingt beinflussen mit Fernsteuerung.
- Globale Strahlung (Erwärmung durch Fenster)
- Wind (kühlt ab)
- Luftfeuchtigkeit
- Industrie-Gebäude abkoppeln: Bei einer Störung kann der Kunde Nr. 6 abgekoppelt werden (eigene Ölheizung vorhanden). Von der Ökobilanz her sind die Gaskessel aber klar besser als die individuelle Ölheizung.
PV self-consumption optimization
Evaluate and optimize trade-offs in the design of battery storage for PV systems
With the AEW data of a 60 kWp PV installation, we optimized the solar energy self-consumption by a battery system. For this, we calculated different parameters such as battery load, new self-consumption and new grid supply and estimated the optimal battery capacity with further values such as energy and battery prices, life span, contract duration, minimal charge, maximum load power in Google sheet and as well with Python.
Finally, our customer can select, whether he wants the most economical battery solution or maximise his autarky. Our tools calculate the maximized economic benefit over lifetime.
Google Sheet Prototyp
Github
https://github.com/ehackdays/PV-Optimisation Contains initial Python implementation and some exploratory analysis, see also README below.
29.08.2020 12:02
Analysis and Design of Battery Storage for PV Systems
Challenge No. 2 @ Energy Data Hackdays 2020
This repo contain some additional analysis scripts that use the original data files (CSV) provided for the challenge.
Data
Data on power generation, grid feed, grid supply and overall consumption of three power plants by AEW Energie AG. First time published for the Challenge 3 of Energy Data Hackdays 2020 in Brugg. A.csv B.csv C.csv
For questions on the data, reach out at https://github.com/zuzfil/PV-optimisation/issues.
The data were created during the operation of AEW-owned PV plants in 2019. The plants are all located in Aargau, Switzerland. The power values in kW refer to the average over the 15min period.
License
This Data Package is made available by its maintainers under the Public Domain Dedication and License v1.0, a copy of the full text of which is in LICENSE.md.
Photovoltaic: Where is it Best?
Where solar photovoltaics make the most sense
Challenge #10
Warum:
Die Verbreitung der Solar-Photovoltaik in der Schweiz ist nur in grossem Umfang möglich, wenn sie wirtschaftlich sinnvoll ist und gleichzeitig die Treibhausgasemissionen reduziert.
##Idee: Diese beiden Faktoren können durch einen Vergleich der Lebenszykluskosten (LCC) und der Lebenszyklustreibhausgasemissionen (LCE) mit ihrem lokalen Stromtarif und dem LCE des Strom-mixes der Versorgungsunternehmen bewertet werden. Die LCC und die LCE variieren für jedes einzelne PV-System, abhängig von ihrer Grösse, den erneuerbaren Ressourcen und anderen technischen Faktoren.
Angesichts der bisherigen Erfahrungen des PSI über das PV-Erzeugungs-potenzial und -kosten kann diese Analyse durchgeführt werden, um mehr Erkenntnisse darüber zu gewinnen, wo der Einsatz von Solarphotovoltaik in der Schweiz am sinnvollsten ist.
Where solar photovoltaics make the most sense
##The big picture:
The rollout of solar photovoltaics to a great extent in Switzerland is only possible when they make economic sense and at the same time reduce greenhouse gas emissions.
Idea:
These two factors can be assessed by comparing the Life Cycle Cost (LCC) and Life Cycle greenhouse gas Emissions (LCE), with their local electricity tariff and the LCE of electricity mix supplied by utility providers. The LCC and LCE varies for each individual PV system, depending on their size, renewable resources, and other technical factors.
Given the previous experience on PV costs and generation potential, this analysis can be undertaken to give more insights on where it makes the most sense to deploy solar photovoltaics in Switzerland.
Call for expertise
- GIS expert
- Application/UI developer
- Energy consultant/scientist
- Expert from government/utilities working on PV system rollout/implementation
Questions to answer in two perspectives:
-
Country-wide (mainly analysis): how much potential do we have for Switzerland considering LCC and LCE in a realistic sense
-
Individual resident (requires UI): - Does it make sense to install PV on top of my roof - How can I find residents around me with similar conditions/interest to reduce system investment cost (economy of scale)
Data
- levelized cost of electricity for each roof in Switzerland from this analysis by Technology Assessment Group, Laboratory for Energy Systems Anlaysis, PSI
- local electricity mix by electricity generation technology for municipalities and entities in 2018, obtained from Stromkennzeichnung
- 2 sources for PV potential in Switzerland
- data from Sonnendach
- data from Walch, A. 2020
- life cycle greenhouse gas emissions (LCE) per kWh for different electricity generation technologies based on ecoinvent version 3.6
- electricity tariffs in Switzerland from ElCom
- simulating the performance of photovoltaic energy systems (pvlib-python)
- is a community supported tool that provides a set of functions and classes for simulating the performance of photovoltaic energy systems. It was originally ported from the PVLIB MATLAB toolbox developed at Sandia National Laboratories.
- see more on project gibhub page https://github.com/pvlib/pvlib-python
- remuneration from electricity providers
- an official portal providing numbers on compensating the electricity production using PV in households - pvtarif.ch
- https://www.vese.ch/wp-content/uploads/pvtarif/pvtarif2/appPvMapExpert/pvtarif-map-expert-de.html
- there is an API but the data license forbids any use of this data in digital form in research
Thinking process
In this project we did additional study and compiled research notes, sample data and suggestions, expanding on the original challenge
- Limitations of the solardach.ch calculator
- 1.1 Number of factors: it considers factors like solar irradiance, angle of roof area, shading. The new study also considers additional factors like temperature (which affects the module efficiency), obstacle structure on roof (based on machine learning) = more realistic estimate --> use data from new study
- 1.2 Calculation not based on current technology/efficiency factor: Someone planning to build a new PV installation would (reasonably) use the latest technology, while most calculations by tools are based on averages (which consist of a mix of old and new technology). Estimates for kWh potential might be 1/3 to 1/2 too pessimistic. --> use better data based on new technologies?
- 1.3 Grid network restrictions (maximum power which can be fed into the network): depending on location (more rural = usually worse), maximum capacity which can be fed into the network is much lower, dependent on three factors: connecting cable ampacities, voltage range limitation, and transformer power rating. Data on these three factors is proprietary information of the electricity companies. Might be in a range between 0 and 90% restriction on potential --> data is not openly available. Is there any way we can find a proxy? (especially for CH-wide potential estimate) --> for individuals data might be retrievable from their energy provider for inclusion in calculators (e.g BKW online portal offers the information for individuals for their own place)
- Calculate potential (economical)
- 2.1 Consider energy usage in network: network limitations might be less extreme because numbers given are based on no consumption --> unclear how this can be estimated
- 2.2 effects of everyone having PV installed: excess energy supply at peak times in an area = limitation of the network
- Calculate potential (environmental)
- 3.1 data on energy mix by city is available
Link to Drawing of data structure

Network Limitations
The past generation potential estimates don't seem to take into account the limitations of the network infrastructure. There are three limiting factors related to adding PV to the existing network: connecting cable ampacities, voltage range limitation, and transformer power rating:
- the voltage increase due to feeding in from a new PV cannot exceed +3% threshold allowed by law
- the current increase due to feeding in from a new PV cannot cause the current to exceed a cable rating (on the entire chain from house to transformer)
- the power fed in by a new PV cannot exceed the transformer rating; the ones connected to the medium voltage grid or others connecting any intermediate subtransmission (1000V intermediate voltage system) network
The available public data does not include any of this (cable ratings, network topology, transformer ratings) since it is all proprietary to the power company (Elektrizitätsversorgungsunternehmen or EVU).
Using proprietary data and comparing the Sonnendach available roof area capacity (sum of all roof sections identified, i.e. good, marginal and bad, using the maximum area) with the calculated maximum feed in values for the electrical connection of the utility, shows a large overestimate of the energy capacity for rural and industrial sites.
| Location | Type | Sonnendach | Network Max | % Over |
|---|---|---|---|---|
| Uerzlikon | house | 75500 | 59000 | 28 |
| Uerzlikon | house | 61700 | 71000 | 0 |
| Uerzlikon | apt 2½ | 56800 | 48000 | 18 |
| Uerzlikon | farm | 128300 | 29750 | 331 |
| Uerzlikon | farm | 505400 | 33850 | 1393 |
| Biel | industrial | 235400 | 183000 | 29 |
| Biel | industrial | 244300 | 140000 | 75 |
The network maximum is calculated under the worst case assumption that all PV (proposed and installed) are generating at the maximum (peak) value and no consumption is occuring. By and large, the majority of these limitations are based on an over-voltage situation (>3% above nominal). This engineering limit would not normally apply when the PV owner self-consumes or the energy is shared with neighboring consumers.
These network maximums are also calculated when only one additional PV is installed (at the indicated site). So this brings up the additional issue that, should everyone in an transformer service area have a PV installation, these maximum values would be replaced by other limitations, for example overloading of shared cables, overloading of supplying transformers or general over-voltage conditions from multiple injection points. A more detailed analysis is needed on a per transformer service area basis with perhaps PV installations at only the most opportune locations (large area, south facing roofs).
Thus, the “Life Cycle Cost”, LCC, would need to include upgrades to the network infrastructure with the addition of large amounts of PV, or the maximum potential for PV installation would need to be adjusted downwards under the assumption of no network upgrades.
Regarding the proprietary data needed for the engineering analysis:
- the data is owned separately by each of the over two hundred EVU in Switzerland
- these EVU are very unlikely to be able to provide this network data due to privacy restrictions and competitive considerations
- only a small fraction of the German speaking EVU are doing this maximum feed in analysis on a broad scale
- for these few, the best approach may be to provide a list of candidate sites with kW suggested and ask if their network can support this size of installation at those sites
Put CH on Electricity Map
Raise awareness and support global climate goals
Help meet the Paris Convention goals to achieve net 0 by 2050, less than 2 tonnes CO^2 per person! We want to raise awareness around energy use and consumption by putting Switzerland on the map at electricitymap.org and put its open data API to use. (Challenge #11)
28.08.2020 15:04 First solution ideas have been explored and discussed. Beer has been deployed.
28.08.2020 23:00 Despite some hurdles we got everything ready for our idea but realised that it won't be accepted by electricity maps.
29.08.2020 11:00 Complete restart to a much simpler model that will hopefully be accepted by electricity maps and still be better a gray spot on tha map.
29.08.2020 13:40 Ideas are tested and documented. However, it's not running live.
Read your own Smart Meter
Lokale Schnittstelle zu Smart Meter inkl. Darstellung auf Web Oberfläche
- nikki_bhler
- cdollfus@infobridge.ch
- Vanya87
- brauliobarahona
- xuewang
- aselviar
- wimton
- GEAG
- RayNeubauer
- PeterZbinden63
- tamberg
- derrickoswald
- HubertKirrmann
(English below) #Eigenen Smart Meter auslesen (#3)
Ziel
Eigenen Smart Meter durch die lokale Customer Information Interface (CII) Schnittstelle auslesen und Stromverbrauch visualisieren. Dashboard mit den wichtigsten Informationen gestalten.
Idee
Zwei Smart Meter werden vor Ort installiert und werden den Verbrauch von unterschiedlichen Geräten messen. Der Live-Verbrauch wird auf einem web-basierten Dashboard visualisiert. Live-Werte werden mit historischen Daten kombiniert. Am Ende kann das Dashboard einer Person klare Auskunft über die wichtigsten Informationen bezüglich des Stromverbrauchs geben.
##Warum: In der Schweiz ist es gesetzlich vorgeschrieben, dass alle Smart Meter, die von Energieversorgern installiert werden, eine lokale Schnittstelle (CII) haben, so dass die Kunden Zugriff auf die eigenen Daten haben können. Das schafft mehr Transparenz, da die Kunden ihre eigenen Daten managen können. Innovation wird ermöglicht, weil genaue Daten neu gratis in Echtzeit verfügbar sind.
##Data:
- Live-Messungen mit Hilfe von Smart Metern
- Historische Daten Testanlage EKZ
- Eine kurze Einführung zu den Kommunikationsprotokollen der Smart Meters findet man hier: https://icube.ch/DLMSSurvivalKit/dsk1.html
#Read your own Smart Meter
##Goal: Read your Smart Meter through the local Customer Information Interface (CII) and visualize your consumption. Design a dashboard with the most useful information.
Idea:
Two Smart Meters will be installed on-site and will be measuring the consumption of different devices. The live consumption is to be displayed on a web-based dashboard. Live measurements are to be combined with historical data. At the end, the dashboard will be able to display the most important information to an individual about their electricity consumption.
##Why: In Switzerland, it is prescribed by law that all electricity Smart Meters installed by utilities must have a local interface (CII), so that customers can have access to their own data. Transparency is increased as individuals can manage their own data. Innovation is promoted, as precise data is available for free in real time.
See also Challenge 582: "Unleashing the Swiss Smartmeter's CII" https://hack.opendata.ch/project/582
##Data:
- Live measurements from Smart Meters
- Historical data of an EKZ test site
- Short introduction to Smart Meter communication protocols can be found here: https://icube.ch/DLMSSurvivalKit/dsk1.html
Members of the team: Moritz Bolli Peter Zbinden Derrick Oswald Hubert Kirrmann Hermann Hueni Angelos Selviaridis Christos Konstantinopoulos
28.08.2020 14:34
The team will focus on moving data from the metering system and visualizing the data graphically. It will not rewrite the existing proprietary components.
28.08.2020 14:38
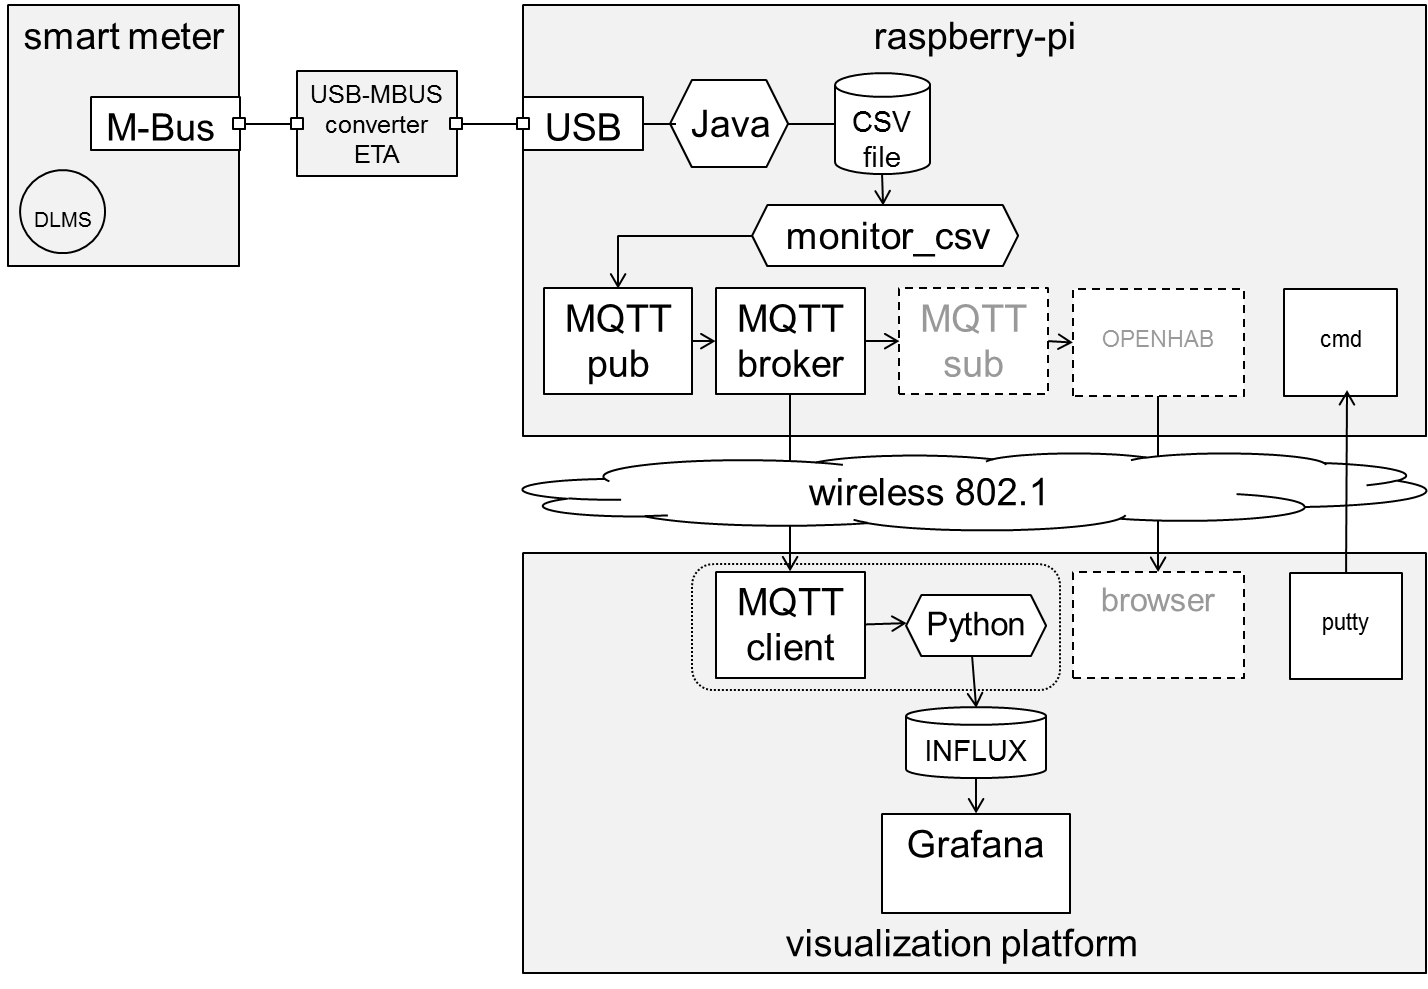
A quick prototype system has been constructed. There is a MQTT broker installed on the Raspberry Pi. It is fed by a bash script that monitors the log file of the proprietary software and publishes on four topics at roughly 5 second intervals:
- smart_meter_events/raw sends messages containing the text of each new line in the proprietary software CSV file
- smart_meter_events/voltage sends a time stamp and the voltage
- smart_meter_events/pf sends a time stamp and the power factor
- smart_meter_events/power sends a time stamp and the power MQTT clients, for example on members laptops, subscribe to the above topics and reports the messages as they are received. Graphing software has been prototypes to display the time series (sample data).
28.08.2020 14:42
OpenHUB 2 has been installed, and still being worked on, but as yet not successful.
28.08.2020 14:53
Initial success in reading the data and transferring it to a PC has been demonstrated.
28.08.2020 14:55
Smart meter readings are saved to the InfluxDB database by a MQTT <=> InfluxDB bridge python script.
28.08.2020 17:35
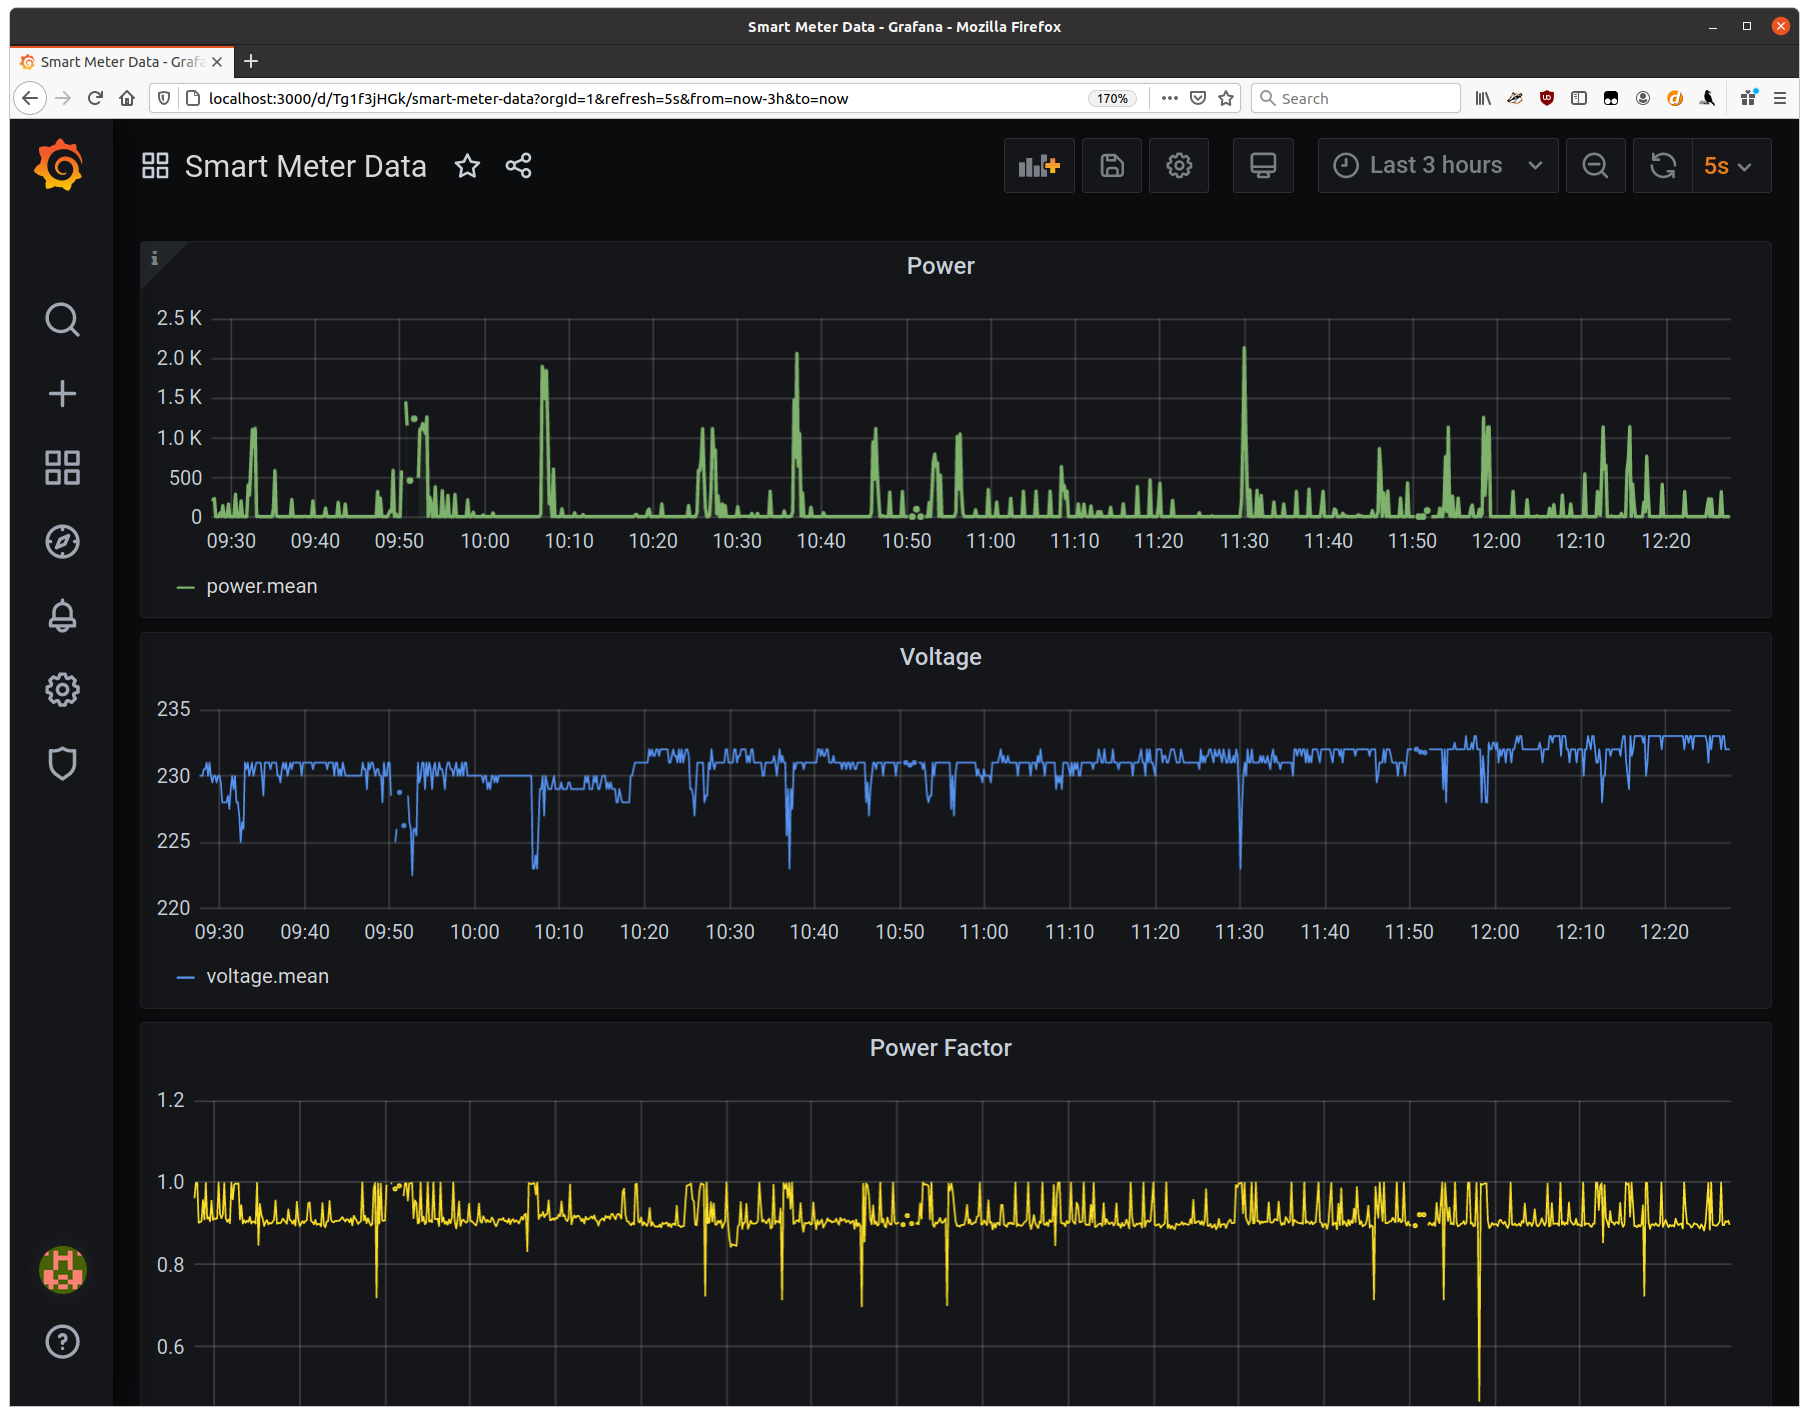
The first successful dashboard has been created with Grafana.
28.08.2020 18:18
Presented at Open Energy Data Hack Days - Saturday, 29 August, 2020
01.09.2020 05:58
Source code is available, per the Source link.
01.09.2020 06:00
CII Read Your Smart Meter
Read your own smart meter and visualize your electricity consumption. Create dashboards with valuable information and share it!
Goal
Read your Smart Meter through the local Customer Information Interface (CII) and visualize your consumption. Design a dashboard with the most useful information.
Idea
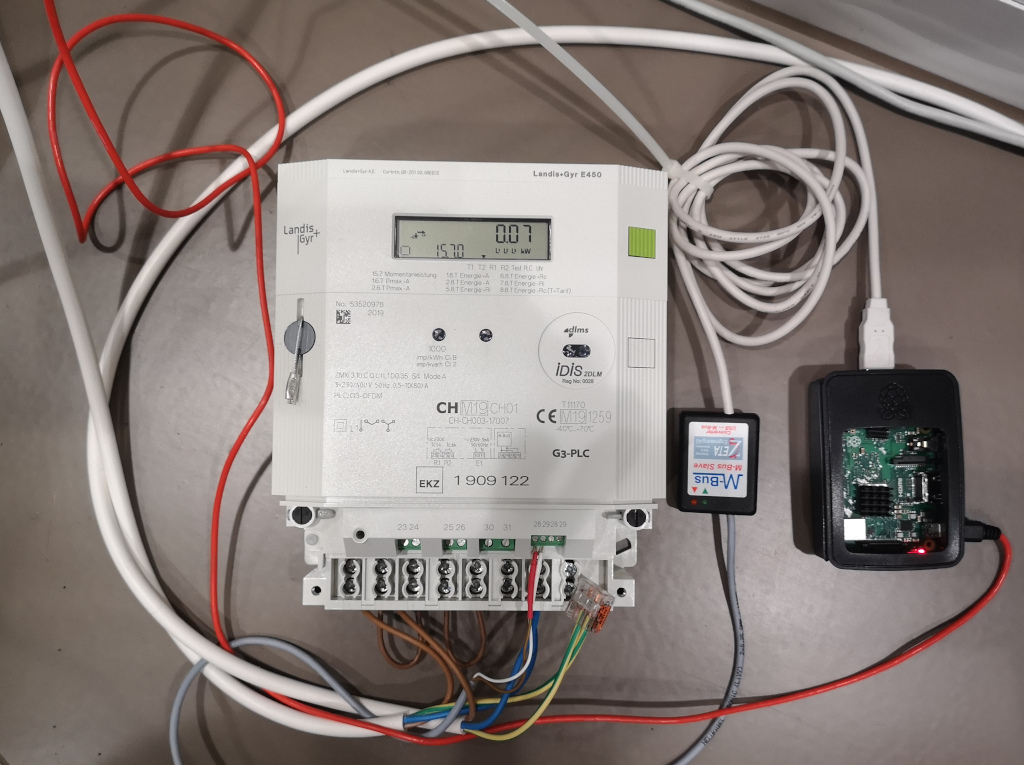
Two Smart Meters (Landis+Gyr E450)
will be installed on-site and will be measuring the consumption of different devices.
The live consumption is to be displayed on a web-based dashboard.
Ideally, live measurements are to be combined with historical data.
At the end, the dashboard will be able to display the most important information to an individual about their electricity consumption.
 .
.
Why
In Switzerland, it is prescribed by law that all electricity Smart Meters installed by utilities must have a local interface (CII), so that customers can have access to their own data. Transparency is increased as individuals can manage their own data. Innovation is promoted, as precise data is available for free in real time.
Data
Live measurements from Smart Meters Historical data of an EKZ test site
Architecture Diagram
Setup Procedure
The setup basically follows the approach outlined in two DIY IoT blog posts (Connect Raspberry Pi to MQTT and Display using InfluxDB and Grafana)
Raspberry Pi
Connecting to the Raspberry Pi requires knowing its IP address. This was provided access the existing Team-Viewer installation. Access to a bash session on the Pi can then be obtained with ssh or Putty. For example:
ssh pi@172.28.255.239
Mosquitto
MQTT broker and client software.
Install the MQTT (Message Queuing Telemetry Transport) broker and client on the Raspberry Pi:
sudo apt-get install mosquitto mosquitto-clients
MQTT publish
Bash script file change notification tool.
Rather than write a program that would replace the proprietary jar file, a simpler bash script approach was used. This requires a way to trigger commands when the contents of the CSV file being written by the proprietary jar file changes. Although there are many solutions, the inotify approach was used.
sudo apt-get install inotify-tools
Then run the bash script monitor_csv on the Raspberry Pi:
./monitor_csv
Client Computer
InfluxDB
Time series database.
The smart meter measurement events are stored in an InfluxDB database.
sudo apt-get install influxdb influxdb-client
Run the MQTTInfluxDBBridge.py python script to start moving the MQTT messages into the InfluxDB:
python3 MQTTInfluxDBBridge.py
After a few messages are processed, the database can be exercised with the influx command line tool:
$ influx
> use smartmeter
> show measurements
name: measurements
name
----
pf
power
voltage
> select * from voltage;
name: voltage
time                timestamp           voltage
----                ---------           -------
1598634419180514187 28.08.2020 19:06:59 229
1598634424287928040 28.08.2020 19:07:04 231
...
> select * from pf;
name: pf
time                pf    timestamp
----                --    ---------
1598634419180514187 0.912 28.08.2020 19:06:59
1598634424287928040 0.91  28.08.2020 19:07:04
...
> select * from power;
name: power
time                power timestamp
----                ----- ---------
1598634419180514187 10    28.08.2020 19:06:59
1598634424287928040 11    28.08.2020 19:07:04
...
Grafana
Time series visualization software.
Follow the instructions:
sudo apt-get install -y adduser libfontconfig1
wget https://dl.grafana.com/oss/release/grafana_7.1.5_amd64.deb
sudo dpkg -i grafana_7.1.5_amd64.deb
sudo service grafana-server start
Then browse to Grafana and login (username: admin, password: admin). The Explorer tab lets you make ad-hoc queries, and the Dashboards tab lets you create a dashboard using a nice GUI.
UI
Smart Meter Anomaly Detection
Challenge #14: "Anomaly Detection for Smart Meter Devices" from the open energy hackdays 2020
Demo: https://meteros.staging.akenza.io/
28.08.2020 12:54
Project scope has been defined and work has been started
28.08.2020 19:54
We have deployed a very first version to a k8s cluster which can be viewed here: https://meteros.staging.akenza.io/
The backend still needs some work though, the frontend does not query the data from the backend yet
28.08.2020 23:25
We drafted definitions of anomalies (human definitions) and meter data is sent to the cloud where it is processed and stored along with various improvements to the UI. The current state can be checked at the project link.
The API and online processing of the data (live detection of anomalies) is still to be implemented.
29.08.2020 12:38
The last finishing touches are being applied. Forecasts have been removed from scope due to time restrictions.
meterOS - Smart Meter Anomaly Detection
Challenge #14: "Anomaly Detection for Smart Meter Devices" from the open energy hackdays 2020 (Clemap)
Energy consumption in buildings and industry is often wasted due to user behaviour, human error, and poorly performing equipment. In this context, identifying abnormal consumption power behavior can be an important part of reducing peak energy consumption and changing undesirable user behavior. With the widespread rollouts of smart meters, normal operating consumption can be learned over time and used to identify or flag abnormal consumption. Such information can help indicate to users when their equipment is not operating as normal and can help to change user behavior or to even indicate what the problem appliances may be to implement lasting changes.
This challenge is looking for data scientists to apply their skills to an anomaly detection problem using smart meter data. Ideally, such an algorithm should begin to operate after as little as 3 months and should improve over time. A platform to visualise the anomalies would also be useful. Users can select any type of machine learning algorithms that they wish to in order to detect the anomalies from the data.
Group Members
- Raimund Neubauer
- Vikram Bhatnagar
- David Giger
- Marius Giger
In Collaboration with
- Manuel Baez
- Konstantin Golubev
- Xue Wang
The pitch can be found ./20200829_meterOS_Energy_Data_Hackdays_2020_Pitch.pptx.
Data
A sample including smart meter data can be found on kaggle. Participants are encouraged to find other smart meter data to work with in order to test their algorithms.
During the course of the Hackathon, we have created multiple other anonymised datasets (kindly provided by Solarify) that can be found under ./anomaly-detection-model/data.
Approach
- Create a basic model to detect anomalies
- Create a visualization layer to present anomalies
- Get more data of smart meters and possibly publish the datasets on opendata
- Implement a flexible architecture to allow the online processing of new data points
- Simulate incoming data with the newly acquired datasets
- Implement online prediction of anomalies
- Implement online learning

Implementation

We have implemented a scalable architecture, based on the following components:
- Smart Meter Simulator based on Iotify
- Meter-Service: Microservice that receives, processes, stores and exposes meter data
- Meter-UI (meterOS): UI to display meter data and anomalies
- Anomaly-Detector: Running App with deployed Anomaly Detector model (Thanks to Konstantin Golubev, Manuel Baez, Xue Wang)
- Kafka Data Stream for real time processing
Model Selection
Our approach is to combine expert knowhow and statistical models to detect anomalies. Further, for us to understand if our model has produced useful outputs, anomalies should be labelled based on a predefined set of characteristics (e.g. peak energy consumption, high baseload etc.).
Expert Model
To find out what a human would consider as an anomaly, we did an extensive analysis on a smart meter dataset: ./anomaly-detection-model/Manual_Anomaly_Detection_V3.docx.
Very simple cases of anomalies should actually be detected using expert knowhow. For this, we defined a standardised expert model based on historic data:
- Structure load curve on weekly basis
Possible Features:
- Baseload (especially during weekends)
- total baseload
- delta baseload
- Fast Fourier Transform (Frequency Analysis)
- small variance in amplitude is good for energy producer
- Gradient might be interesting, because it might indicate unusual increases in energy consumption
- Negative values
- Zero values
Stats/ML-based
A more sophisticated ML/Stats-based model should be used to find unusual patterns, that are hard to detect by static rules and therefore might not be easily quantifiable by experts.
Models
We have tried the following models:
- Isolation Forest: Isolation Forest detects anomalies purely based on the fact that anomalies are data points that are few and different.

- One Class SVM: Unsupervised Outlier Detection based on a Support Vector Machine. It is known to be sensitive to outliers.

- ARIMA Model: Time-series forecasting model and analysis of the prediction deviation. Also possible to spot patterns accross time.


- Monte Carlo Model: Frequency analysis of kWh values. Monte Carlo Approach -- call single reading of a meter anomalous if it hasn't appeared often in the past. Blazingly Fast (can run on Raspberry Pi), Adaptive, Easy to tune. Not able to detect patterns that span accross time.
A possible way forward could be to implement different models for different temporal patterns:
- Minutely/Hourly Model (Online) --> Predictive Model
- Daily Model (Historic)
- Weekly Model (Historic)
Unleashing the Swiss Smartmeter's CII
Empower citizens to use their energy data. Using the smartmeter's CII beyond visualisation to steer local consumption.
Introduction
Swiss law (StromVV Art 8a) requires all installed smartmeters to offer a local "consumer information interface" (CII) to provide all measured data at the moment of its recording. Despite 2+ years since this has become mandatory by the end of 2017 it is still very hard to obtain sufficient information from the DSO (distribution system operator) on the particular CII put in place on the installed smartmeter.
Different technical interfaces (CII) are in use on various smartmeters in Switzerland which inhibits interoperability for innovative solutions. It is almost impossible to find publicly available information on what kind of CII is offered by the 600+ different DSO of Switzerland.
Where as in the netherlands, the energy sector organisation (netbeheernederland.nl similar to VSE in Switzerland) has required all smartmeters installed during the past years already to offer the same well designed CII called DSMR P1 (also adopted by Belgium and Luxembourg), the swiss authorities or the market participants have regrettably not decided on a mandatory standard to be required. This unfortunate situation has inhibited the market in Switzerland for innvovative applications. And a large amount of money and ressources is currently spent (and are finally wasted) by installing additional private energy meters behind the DSO's smartmeter.
See also [D]: https://forume.ch/t/kundenschnittstelle-der-intelligenten-messsysteme/938/4
Let's try to improve on that.
Motivation
One motivation to use the CII beyond visualisation might come from the following problem definition:
Photovoltaic systems (PVS) with an output of 5-15 kW are increasingly being installed on roofs of swiss houses. Often there is a 300 L electric boiler connected on 3 phases of 400 V with a power of 6 kW for the hot water demand, which is charged during the night via a ripple control of the DSO. Because Art 8c of the StromVV has obliged the DSOs since 2018 to remunerate the customer for such flexibility useful to the grid, some DSOs remove the ripple control when connecting a new PVS to the grid and at the same time installing a smartmeter.
If energy is permanently supplied to the electric boiler, around 30-50% of the annually required heating energy of approx. 3.8 MWh/a [1] can already be used from the PVS production. By means of an electronic control system, an additional max. of 40% of the grid supply could be substituted trough PVS production. With a tariff difference between the feed-in tariff and grid procurement of approx. 100 Fr/MWh, savings of only 150 Fr per year would result.
For an economic solution, the costs for the necessary power control (including installation) should not exceed a few 100 Fr. However, many products available today [2] quickly require investment costs of 1'000 - 3'000 Fr which is far beyond any efficient and economically justifiable solution.
[1] https://www.energie-lexikon.info/warmwasser.html
[2] Example: (a) Energy4me units 1'083 Fr [ control unit 377 Fr, switching power supply 39 Fr, AC meter 248 Fr, thyristor controller 280 Fr, mains filter 139 Fr ] Q:https://www.energy4me.ch/energiemanagement/ (b) Expenses for electricians for installations: 500-1'000 Fr.
Goals & tasks
Together we shall discuss and demonstrate how easy and cost-efficient a simple solution to this scenario can be put in place using DSMR-P1 with an ESP Microcontroller and a piece of open-source software coupled with a very affordable wifi-enabled powerswitch-actor. Attaching any of the various visualisation- or energymanagement-sytems (EMS) for home automation over MQTT might then be relatively straight-forward.But the key challenge is how to deal with the diversity of CII such that all citizens may get easy and efficient access to their own owned energy data. Many additional questions still have to be worked on. We hope that we may tackle some of these together with the expertise of those supporting this challenge.
29.08.2020 07:19
We developed a concept and PoC roadmap to provide a "universal" adapter from smart meters to home IoT platforms, see "Source" for details.