Report
💡 Active projects and challenges as of 22.07.2026 02:12.
Hide text CSV Data Package Print
020_Open Habitation
Aggregating data to search the sustainability of offered real estate
We created a minimal API that aggregates data from GeoAdmin (Swisstopo) and PVGIS (EU) to calculate a score for any building property which is in the Open Data sources. Plans to build on this and add crowdsourcing capabilites have been discussed.
Please note: At the moment, the calculation of PV production does not work properly. But the rough procedure as well as the API-queries are correct. We have to change little things and we will update as soon as possible.
Presentation
https://youtu.be/gstFXCWe4rI?t=6832
Next steps
(1) Complete basic functionality of the prototype
- https://marshmallow-sqlalchemy.readthedocs.io/en/latest/index.html to persist the DB properly
- https://swagger.io/docs/specification/describing-request-body/ to create a valid spec
- https://frictionlessdata.io/standards/ for making the data portable and valid
- https://github.com/PWZER/swagger-ui-py/issues/29 to integrate OpenAPI
(2) Build on the (Falcon based) Web API
- https://github.com/falconry/falcon/wiki/Complementary-Packages for extra features
- https://github.com/arivero/SampleAnonAPI is an example Falcon data anonymization project
- https://github.com/vicinityh2020/vicinity-vas-dreven example Falcon smart charging project
- https://github.com/bookla-foundation/meerkat more info on RESTful Falcon apps
- https://apispec.readthedocs.io/en/latest/using_plugins.html for integrating Marshmallow
(3) Make further improvements to the data model
- https://www.opendataphilly.org/dataset/housing-production
- https://data.stadt-zuerich.ch/dataset/bau_best_geb_jahr_gebart_bauperiode_quartier_od5087
- https://www.housing-stat.ch/de/home.html
- http://carboncoop.greenopenhomes.net/
- https://wikirateproject.org/About_Us
- http://ecofriendlyhouses.net/
Challenge
How sustainable is this property?
- The building sector still has huge impact on climate change, altough co2-reduction is relatively easy (and cheap) to reach.
- When choosing the next property (rental or buying), the environment plays a role that is too small. As a result, investors are less interested in green solutions. One reason why ecological aspects are not taken into account in the selection is that no (or not enough) information is available for home-seekers.
- let's provide this information!
- "collect and combine" public information of offered real estate (heating system and - if time remains - photovoltaics, building standard, access to green mobility ...). Provide this information for real estate marketplaces.
Open Habitation API
This is a project started at the Energy Data Hackdays 2021. Please see our project page for background and have fun.
Service
This repository contains a minimal backend service API based on the Falcon framework, Pandas DataPackage Reader, and the Falcon plugin for apispec.
Use pip with requirements.txt or install the Poetry dependency manager, and:
poetry install
poetry shell
python api.py
To update the requirements file:
poetry export --without-hashes -f requirements.txt > requirements.txt
License
This package is licensed by its maintainers under the MIT License.
If you intended to use these data in a public or commercial product, please check the data sources themselves for any specific restrictions.
04_Merge big data from today with historical ones
Impulses and hurdles for sustainable development per municipality
What is it about?
The Swiss energy system is transforming, but how? How did it change from last year to this year, from yesterday to today? How will the forecasted energy system for 2050 differ from today’s one? So far, we lack smart approaches to identify present and future changes in the energy system that go beyond aggregated indicators such as annual electricity demand changes or new power generation capacities installed.
Challenge
In this challenge, we ask the team to develop a platform, in which users can upload big energy data (e.g., time series of electricity generation) and compare their data with other historical or model-based energy data, using novel indicators of energy system changes.
Pitched by https://nexus-e.org/
Presentation
05_Smart Meter Open Dataset
Build a platform where people can freely donate their energy data to society
What is it about?
Although we all are producing more and more data, access to this wealth of information is becoming increasingly difficult for data protection reasons.
As a consequence, researchers and developers don't have freely accessible, comprehensible, high-quality datasets on individual European households to build their theories, algorithms and applications from.
We want to build a platform where people can freely donate their energy data to society so that science and research can support our energy transition with fair, democratic innovation.
More information will follow soon.
Presentation
https://youtu.be/gstFXCWe4rI?t=1442

06_Spatio-temporal model of an on-shore wind farm
Better market predictions before you put energy into the grid
Why is it relevant?
A spatio-temporal model is of great interest within the wind energy community for more accurate wind speed forecasting, which helps to better estimate power production and to develop optimized control strategies.
The challenge
In this challenge we want to develop a spatio-temporal model of an on-shore wind farm near a coast in Brazil. The goal of the model is to be able to visualize and investigate the local winds and the interaction between turbines, in form of wake effects, within the farm.
Data
For this we provide a dataset that contains the 10-minute average wind speeds, the wind directions and the geographic coordinates of 32 wind turbines and 1 met mast tower for a period of 1 year.
See also: https://www.iet.hsr.ch/index.php?id=18317&L=562
Presentation
07_Can you beat the model performance benchmark?
Do you have a new idea for a model using one of the datasets? Can you improve on the existing models?
Can you beat the model performance benchmark?
VIA seeks models to help address the most important clean energy challenges:
- 24-hour load prediction
- Anomaly detection
- NILM (non-intrusive load monitoring)
The challenge:
Three smart meter datasets are available:
- Low Carbon London dataset with 167 million rows (link)
- Reference Energy Disaggregation Dataset with 1.7 million rows (link)
- REFIT Electrical Load Measurements with 114 million rows (link)
Do you have a new idea for a model using one of the datasets? Can you improve on the existing models?
Utilities will be able to “upvote” and “downvote” a description of your proposed model to give you feedback before you begin model development. Interested utilities will reach out to prefered analysts through the secure VIA Insights Market™ (logins provided at the event) and be able to directly test your model on their data. Each utility’s data remains private and secure. You will receive a ranking of the performance of your model versus industry benchmarks.
Requirements:
Models must be in Tensorflow 2.0 protocol buffer (.pb) format and a link to your model must be submitted as a comment in your model proposal page on VIA Insights Market™.
Presentation
https://youtu.be/gstFXCWe4rI?t=2176
About VIA:
VIA is powering the clean energy revolution. VIA's AI platform helps organizations drive operational efficiencies and collaborate across the energy ecosystem by overcoming challenges related to data quality, data scarcity, and data privacy. We work with governments and the largest power providers in the US, Europe, and Asia. Now, we need your help to make an even bigger difference.
08_Digital twins for domestic heating systems
How can digital twins help us to safe energy while keeping our appartements warm and guaranteeing that sufficient hot water is available?
Digital twins for domestic hot water and heating distribution systems
What is it about?
In Switzerland, heating and cooling is responsible for 80 % of the residential energy demand. To keep appartements cosily warm and to provide always abundantly cold/hot water at any time. However, complex energy and water systems are required to provide this service 24/7. Motivated by the IOT trend, also the number of sensors installed and recording data from residential energy systems is steadily increasing. To operate these systems energy efficiently, clever control strategies are required to prevent overprovision of hot water or overheating of the rooms. In particular, digital twins attracted recently much attention because these (data-driven) system models enable the optimisation of the energy system without touching it. Join this challenge to explore new applications of data from your home or to actually build digital twins for hot water provision systems or appartements.
The challenge:
In this challenge you will have the possibility to explore the multiple benefits of digital twins. Depending on your background three different directions of the challenge are waiting on you:
-
Hot water provision: Based on measurement data of a domestic hot water system build a digital twin of the system and explore how well you can predict the hot water demand of the system?
-
Appartement: Start from monitoring data of an apartment and develop a data-driven digital twin to predict its behaviour based on external parameters such as the solar radiation.
-
Ecosystem: Which benefits can digital twin provide in the residential context? Which new applications could be realised? Who owns a digital twin? Which fears could arise?
Independent of whether you are an energy expert, a data scientist or an enthusiast, this challenge offers you the possibility to contribute to the energy turnaround in your home.
Data:
Two disparate datasets are ready for this challenge:
-
Monitoring data from two identical domestic hot water preparation system in different buildings. This data set is ideally suited if you would like to develop a digital twin yourself or to showcase the prediction of the hot-water consumption of different users.
-
Monitoring data from a flat including time-resolved room temperature measurements, heat fluxes to the rooms and solar radiation data.
Presentation
09.01 - Customer Data Analytics (Very Basic)
A smaller Project of the initial Idea 09 Customer Data Analytics
#Starting Point
Since the challenge 09 Customer Data Analytics was not accepted, we did together with another not accepted Challenge Owner a small very basic analytics. We tried to find correlations or patterns in the provided File.
#Approach
We used the file provided (anonymized 4'000 data from customers) using BigML and tried to find correlations in the data. The most valuable attributes seemed to be "Amount of contacts to customer center", "creditworthiness" and "Invoice-Type". It turned out, that (unfortunately very obvious) people with high contact numbers to the customer center also have a bad creditworthiness (German: Bonity).
Secondly we found a correlation, that the creditworthiness also correlates to the Invoice-Type. E-Bill-Customers pay their bill very fast (Bonity-Number is low whilst for customers with printed bills, it is much more likely to not pay the bills on time.
Other correlations - like between the Amount of energy could not be found.
#Conclusion
All in all, the dataset was not very valuable (since it had to be cut down for data protection reasons - we are not allowed to use it internally also). That was probably the reason, why the challenge was not accepted. Learning: We have to think about how we want to deal with DA in the future and how we can use it compliant to data protection.


10_Trends in tertiary energy prices
Trends in tertiary energy prices
Tasks
- Get yourself familiar with the TRE market in Switzerland Analysis of historical data (TRE and TERRE bidding prices and volumes, TRE and TERRE activations) to derive patterns of seasonality in the data
- Analysis of the TRE market before and after TERRE introduction in October 2020
- Focus on the selected factors (such as intraday prices) and identify the influence on the TRE energy prices
Note: signing a legal agreement with Swissgrid is required to access some of this data.
Presentation
11_Pre Qualification Test
deriving a representive frequency profile, with which TSO can certfy the providers for the FCR service.
##Tasks
- Analysis of historical data (frequency deviation measurements for FCR, control signal sent by Swissgrid for aFRR) to derive patterns in the data (e.g., using Machine Learning techniques, such as clustering)
- Identify the most prominent patterns in the data and collect them into a set of representative signal extracts
- Combine the signal extracts into an overall signal that is representative enough of various scenarios, for example, base-case signal, worst-case signal with regards to power capacity, worst-case signal with regards to energy capacity, worst-case signal with regards to ramping power, etc.
- Determine the list of tests to be included in the new prequalification test, making use of the signal extracts among other things
Note: signing a legal agreement with Swissgrid is required to access some of this data.
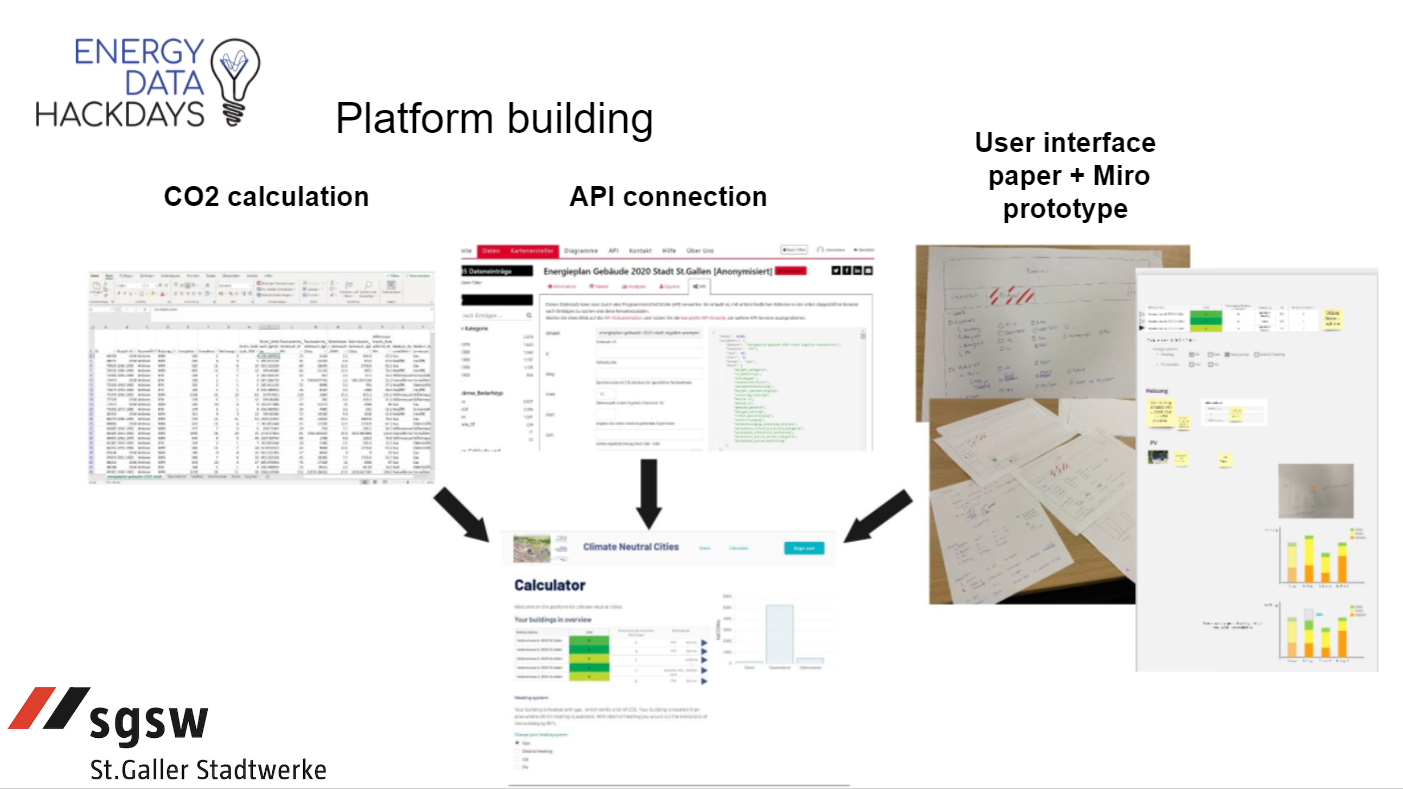
12_Climate-Neutral Cities - St.Gallen Example
Empower actors to contribute to the climate neutral goals until 2050 in cities.
The Challenge
The participants will develop a solution to push people, companies and public authorities to contribute to the climate-neutral target of the city of St.Gallen.
Participants can bring:
knowledge or interest in one or several of these areas: Open Data sources, Footprint Tools, Data Analysis, UX/UI Design, Nudging, Customer Centricity, Gamification ; domain knowledge or interest in one or several of these topics: Energy, Transport, Food.
Why
The origins of the energy strategy of the city St.Gallen date back to 1992. Driven by the urge to make St.Gallen a green and energy efficient municipality, the strategy is based on a clear vision combined with a wide range of measures on various policy and implementation levels. The acquisition and consolidation of data has been the backbone of St.Gallens ap-proach for many years.
In 2020 the city council has decided to further enhance the energy strategy to reach climate neutrality in 2050. Whereas activities until now primarily focused on energy-related measures, the energy strategy is currently extended to include the wide field of consumption. New approaches to foster participation, promote the need to act, define effective measures and monitor achievements are in need. Data will play a significant role.
Data Sources
Several datasets are available from the city, from research projects or from open data sources:
The Data are available on the Open Data Platform of the city of St.Gallen with login restrictions. A personal access with login will be given to the participants.
Previous work - Energy Data Hackdays 2020
Miro Board
https://miro.com/app/board/o9J_luhs87w=/
Live Platform
https://sgsw-json-test.bubbleapps.io/version-test/rechner


Presentation
15_Electricity “Heartbeat” 2035 in the Canton of Zurich
What do changes in the way and in the intensity electricity is consumed mean for our grid?
What is it about?
Climate change forces us to change the way we are consuming and producing energy. The “Energiestrategie 2050” of the Federal Council aims at reducing the environmental impact of energy, foreseeing an increased decentralized energy production in the coming decades. At the same time, technological developments, i.e. electric cars and heat pumps, change the way and intensity electricity is consumed. But what does all this mean for our grid? What is the future of electricity consumption and production? How does the picture change geographically and with time? Can we better understand these changes through visualization? We think we can!
## Challenge: We want to create geospatial visualizations in order to understand where and when electricity is produced and consumed in the grid region of EKZ. We will provide the data and we are asking for your creativity and ideas in order to create meaningful visualizations that shed a bit more light into the future! Here is a little motivation from similar visualizations for traffic intensity in Manhattan, New York:

Data:
We will provide 100% synthetic – but realistic – consumption und production data for 2035 in transformer granularity for most of the transformers in our grid region. The data were generated in the scope of a Master Thesis in cooperation with the Power Systems Laboratory of ETH Zurich. The data is generated based on different assumptions and scenarios of the electricity production and consumption for the Canton of Zurich in 2035
Presentation
16_ “Green” charging E-Mobility
When is it “greener” to charge an electric car?
## What is it about? Electric mobility is a “green” alternative to conventional gasoline and diesel cars. But can it get any “greener”? Can we find a way to reduce the environmental impact of electric car charging even more? When is it “greener” to charge an electric car in winter or in summer? Let’s find out!
Challenge:
With the help of data of CO2 equivalent emissions of electricity production and consumption in Switzerland, we want to analyze what is the environmental impact of charging electric cars. In addition to this, we want to develop a logic in order to charge electric cars as “green” as possible during the day, taking into account the environmental impact of electricity with respect to the time of the day and the different seasons.
Data:
We will provide data of CO2 equivalent emissions of electricity production and consumption for Switzerland and charging stations consumption data. Open data from various sources can also be used.
## Presentation https://youtu.be/gstFXCWe4rI?t=5354

green_charging_emobility
Open Energy Data Hackdays 2021
Link to challenge on Hackdays. Please join this challenge!
Meter data format
- 'id': Unclear, not used.
- 'Chargepoint': The unique identifier (number or UUID) of the physical charging station. One station can have more than one cable, and hence more than one charging session.
- 'connector': The unique identifier (number or UUID) of the physical cable or attached device. In some cases, a cable can be left in the charging station for a long period of time, and used for multiple charging stations.
- 'charge_log_id': The unique identifier (number or UUID) of a particular session charging a battery
- 'metervalue': Not used
- 'increment': The amount of energy transferred (in watt-hours) in the last 15 minutes (i.e. up to the 'timestamp' value)
- 'timestamp': The time of measurement in UTC.
CO2 data format
Columns are renamed to fit those used in the notebook here.
Generic columns
- 'datetime': The time of measurement in UTC.
- 'co2_intensity': The CO2 intensity (g co2/kWh)
- 'co2_production': The CO2 intensity of Swiss production (g co2/kWh)
- 'co2_import': The CO2 intensity of imported electricity (g co2/kWh)
Power in the CH consumption mix (production plus imports minus exports)
All values in MW
- 'nuclear
- 'geothermal'
- 'biomass'
- 'coal'
- 'wind'
- 'solar'
- 'hydro'
- 'gas'
- 'oil
- 'unknown'
- 'battery'
- 'hydro'
Coding standards
Please store notebooks in the Notebooks directory.
Please store data in the Data directory. It will be ignored by git. The data files should be named:
- CH 2020-2021.csv
- metervalues_pseudonymized_2_neu.csv
- metervalues_pseudonymized_1_neu.csv
Data peculiarities
- An
incrementwith values of more than 5500 Wh does not make sense. The maximum power of chargers is 22 kW. The data should be cleaned by removing all values of all charge_log_ids that have at least one value of increment > 5500 Wh. - Some values for 'Chargepoint' are NaN. Luckily this is only the case where the connector is identified by a UUID. Hence we can replace the NaN with a unique number based on the connector UUID
18_Interoperability plug-test for smart meter’s local CII
Empower citizens to use their own energy data. Using the smartmeter's local interface for visualisation and automation
Introduction
Smart Meters currently being installed in Switzerland serve mainly to liberalize the electricity market, but they hardly deliver the promised energy savings because they do not yet provide customers with easy access to their data. StromVV §8a defines the characteristics of smart metering systems requiring a local customer interface (CII), which should allow customers to easily access their own consumption data. Unfortunately, these interfaces are not implemented uniformly by the manufacturers and are rolled out by distribution system operators (DSO) in different configurations. This makes it very difficult for the normal customer to get access to his data.Motivation
The easy and free access of consumption data is a crucial step in the energy transition and shall help to provide the following contribution- give customers transparency about their consumption in real time
- change customer behavior in a sustainable way to save energy
- create innovations that help customers to optimize their own consumption with self-generation (PV) and controllable consumers (car charging station, heat pump)
Idea
Reading of different types of smart meter CII (DLMS, IDIS CII, DSMR-P1, MBUS), used by different DSO (EKZ, AEW, EWB, Romande Energie) by means of a metering data adapter which provides the data to the customer via a harmonized MQTT profile that can be used via an open visualization and automation. The customer can thus view the data at any time and also use it to align his own automation to optimized self-consumption. The MQTT topics should be standardized to provide interoperability between different smart meters and various applications.Data
The data from the different meters are sent via MBUS or DSMR to a adapter which converts the data into MQTT. Different meters are provided by the DSO. The MQTT stream is then integrated into OpenHab 3.0 and ioBroker.Tasks
- Setup of the metering systems
- Conversion of MBUS-DLMS/COSEM data into MQTT using the open-source library from gurux.fi
- Adaption of the DSMR-P1 Protocol to MQTT
- Documentation of the interoperable MQTT interface
- Integration of the smart meter data into ioBroker and OpenHab
Previous work at Energy Hack Days 2020:
- Read your own Smart Meter
- Unleashing the Swiss Smartmeter's CII
- DSMR-P1 Adapter "gPlug" from forumE.ch
Presentation
https://youtu.be/gstFXCWe4rI?t=5852
provided by Peter Kreutzer & Hermann Hüni, GEAG
19_ReFi - Regenerative Finance for smart energy communities
Tokenisation of Energy and Fractional Ownership of Digital Assets provide new possibilities for financing PV-projects.
Background
New information and communication technologies (ICT) are creating whole new industries and opportunities. This will have structural implications also for energy utilities, DSOs, energy communities (EC) and prosumers. The [decentralized finance](https://github.com/sherminvo/TokenEconomyBook/wiki/The-Future-of-Money-%26-Decentralized-Finance-%28DeFi%29#decentralized-finance-defi-toward-a-digital-barter-economy) industry is using new technologies and token economics (TE) that create novel financial applications and business models that can have a significant impact on how the energy transition can be financed. The concept of fractional ownership has been identified as a new possibility to create innovative business models [1]. Utilising tokenisation and DeFi concepts, we could be able to develop flexible, scalable and replicable financing instruments.##The Challenge
Implement the concept of [fractional ownership](https://github.com/sherminvo/TokenEconomyBook/wiki/Asset-Tokens-&-Fractional-Ownership), tokenisation of energy and utilisation of open-source blockchain and DeFi protocols. Build a MVP for fractionalising digital asset (ownership), lending, borrowing and auctioning of those ownership fractions that allows PV systems owners to (re)finance existing or new projects, and trading ownership rights of their projects.##Skills
You do not have to be a full stack developer. Basic knowledge of solidity, javascript or how to build DApp using the react framework next.js and IPFS would be very helpful. Also, if you are new in blockchain you are very welcome to join the project. During the hackathon I will provide information about the architecture, existing code solutions and tools. Vasileios Panagiotidis|[e-swissolar AG] (http://www.e-swissolar.ch/index.php/en/) , Poststrasse 9, 6300 ZugReferences:
*[1] [General Business Model Patterns for Local Energy Management Concepts](https://www.frontiersin.org/articles/10.3389/fenrg.2016.00007/full)*##Results
- Analysis of the off-chain fractional ownership (PV-panel) and crowdfunding process of Solarify
- Analysis for a possible on-chain implementation
- Implementation of the solution using ReFi's smart-contracts using Remix-IDE
- Discussion about the solutions - value creation & open issues
- Next steps